 BCAM Light Sources
© 2009 Alex Asen, Brandeis University.© 2009-2013 Kevan Hashemi, Brandeis University
| Red Laser with Lenses | Blue EZ500 LED | Green EZ500 LED | Luxeon Z LEDs |
The BCAM is a camera with a narrow field of view combined with two light sources. We installed roughly a thousand of them in the ATLAS experiment, and there are hundreds in ALICE, and dozens in CMS and LHCb. Two BCAMs facing one another can monitor one another's light sources, and so measure their relative orientation and position. There are, however, times when a laser diode with its accompanying drive electronics and power supply are not the best way to present light sources to a BCAM. When we wanted to monitor the deformations of a 6-m Long Guide Tube, for example, the sources had to be small enough that we could arrange twelve of them along the length of the tube and view all of them with a single BCAM. In cryogenic fixtures of the ISOLDE experiment, we are reluctant to rely on the proper functioning of any electronic circuit. In such cases, we consider carrying the light from the electronics to the monitoring point with optical fibers or light pipes. We also consider using reflecting targets, so that a BCAM can flash its own lasers and monitor their reflection in a corner cube, spherical ball bearing, or a circle of retroreflecting tape.
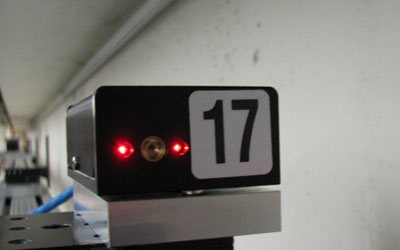
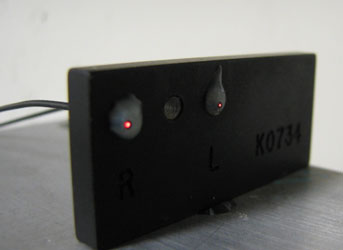
The figure below shows a Black Azimuthal BCAM. Its light sources are a pair of LDP65001E laser from Lumex. There are no collimating optics in front of the diodes. The two lasers are 16 mm apart and allow a viewing camera to measure not only the position of the light sources, but their range and the rotation of the BCAM chassis. The laser diodes offer a rectangular source of light roughly twenty microns wide and fifty microns high. So far as the BCAM optics are concerned, sources this small are like perfect point sources. The laser diode is as near to an ideal point source as we can find: its emission pattern is a rectangular cone of near-uniform intensity. It is so small that obscuring half of it with dust will cause no more than a ten-micron movement in its optical center. It is resistant to ionizing and neutron radiation. The optical center is within tens of microns of the mechanical center of its cylindrical metal package.
By optical and mechanical means, we measure the positions of the optical centers of a BCAMs lasers with respect to the BCAM's mounting balls. We describe this measurement in Calibration. With our roll-cage procedure, we obtain the position of the laser optical centers with an absolute accuracy of better than 20 μm and precision 2 μm.
The Source Plate shown below presents two pairs of laser diodes, each pair facing outwards from the chassis. We used more than a thousand of these in the ATLAS experiment, and there are dozens of similar devices in ALICE. It uses the same lasers and electronics as the BCAM, but does not provide a camera. The result is a less expensive device with a lower profile, which was suitable for mounting upon the end-cap muon chambers of the ATLAS detector.
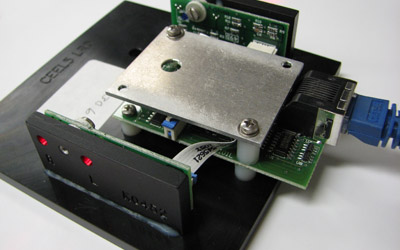

We describe the calibration of the rectangular pieces that hold the laser diodes in Source Plates. We establish the location of these plates with respect to the entire assembly's mounting balls with a CMM (Computer Measuring Machine). By this procedure, we obtain the positions of the laser optical centers with an absolute accuracy better than 20 μm and precision 5 μm.
The Corner-Cube, or Retroreflecting Prism, provides a reflection of a BCAM's own lasers in such a way that these lasers appear to be those of another BCAM at twice the range of the corner-cube, reflected in a mirror, and placed exactly on the line joining the center of the BCAM's aperture and the center of the corner cube. The use of retroreflectors with BCAMs was developed and tested by the CERN Survey Group, and applied by them with success in LHCb to monitor the movements of shielding walls. The retroreflector provides a precise reference point, requires no electrical power, and is resistant to radiation and magnetic fields.

The center of a corner-cube is the intersection of its three reflecting surfaces. Rays that travel from the BCAM laser to the corner-cube and back again cover a distance equal to twice the distance from the laser to the corner-cube center. If we know the position of the center of the corner-cube with respect to the object we wish to monitor, and we have a calibration of our viewing BCAM's laser diodes, we can obtain an absolute measurement of the corner-cube position with respect to the BCAM's mounting balls.
The BCAM measures the bearing or sources with respect to its pivot point. When a BCAM sees its own sources in a retroreflector, it sees a mirror image of itself. As we move the retroreflector, the mirror image moves also. As we rotate the BCAM up and down (pitch) and side to side (yaw), the image moves. But rotation of the retroreflector does not affect the image, nor does rotation of the BCAM about its optical axis (roll).
Although the operation of the retroreflector is simple in principle, in detail it is more subtle. When we obtain an image of the BCAM's own sources, we convert the two spot positions into two lines in the global coordinate system. These lines pass through the BCAM pivot point. But they clearly do not pass through the sources, because these sources lie on either side of the pivot point. What the BCAM sees is equivalent to a mirror image of itself at twice the distance of the retroreflector, as if there were a single mirror at the retroreflecting point, with its plane perpendicular to the line joining the BCAM pivot point and the retroreflecting point. We must describe this arrangement in our reconstruction software, so as to extract from the BCAM spot positions a measurement of the retroreflecting point.
Single mode fibers provide a 10-μm diameter core along which they can transport light that travels exactly parallel to their axis. Because the core is so small, there is no reflection off its boundaries as we might imagine with ray drawings. Instead, the boundaries guide light along the core. Because there is only one way for the light to propagate town the fiber, the light intensity at the tip of the fiber, assuming it is polished properly, is radially symmetric and follows a gaussian power distribution. If allowed to propagate into air, a cone of light emerges, with a gaussian power distribution.
We used the end of an FC connector ferrule as our light source, and provided power to the single-mode fiber with a pig-tailed laser diode we purchased from a supplier. The pig-tailed laser diode consists of a laser diode, a gradient index of refraction lense, and the fiber tip. These are aligned with great care by the manufacturer to within a few microns so that the laser light is focused into the fiber core.
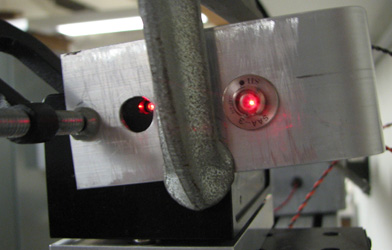
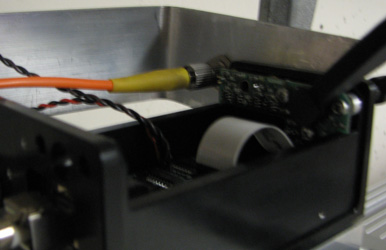
By connecting a pig-tailed laser diode to one of our LWDAQ-based laser diode driver circuits, we can make a BCAM light source. The precision cylindrical ferrule of a single-mode fiber connector is easy to measure with a CMM. The light source lies within a few microns of the center of the ferrule. The problem with pig-tailed laser diodes is their cost. The lense and the alignment procedure are labor-intensive. A 635-nm red laser diode connected to a single-mode fiber and producing 2.5 mW at the fiber tip costs roughly $500 from Thor Labs in 2012.
A standard multi-mode fiber core is 62 μm in diameter with a 125-μm silica cladding around the outside. A single-mode fiber core is closer to 10 μm in diameter. To get light into a single-mode fiber we need a point source and a compound lens. To get light into a multi-mode fiber, we can use a point source and a pair of plano-convex lenses, or we can simply press the base of the fiber up against the emitting surface of a light-emitting diode (LED).
A multi-mode fiber provides many paths by which light can travel along the fiber, but not an infinite number of paths. The paths are called modes, and each mode has a different propagation speed. Because light can travel along many paths to reach the far end of the fiber, a pulse of light entering the fiber will arrive over a short period of time at the far end of the fiber. The light suffers dispersion. If the light entering the fiber is coherent, we will see interference between the different modes. The following photograph shows the pattern of light in the cone emitted by a multi-mode fiber suppied with coherent red light from a laser. The pattern varies dramatically as we flex the optical fiber that supplies light to the tip.

The fiber that produced the above pattern has a 125-μm diameter cladding and 62.5-μm core. Its numerical aperture is 0.22. The source of light is a laser diode, whose light is focused into the far end of the muli-mode fiber with a pair of plano-convex lenses in a focusing light injector, which couples roughly 30% of the light emitted by the laser into the 62.5-μm core of the fiber. We set our lasers to emit 5 mW, so we see roughly 1.5 mW emerging from the fiber.
Despite the variation in light intensity we see above, the tip of a multi-mode fiber supplied with laser light is still a useful BCAM light source. When we observe such a fiber source with the 2-mm aperture of a BCAM camera, we see a variation in light intensity at constant range of roughly a factor of ten. The effective power of the fiber tip varies from 3 mW (which is twice the actual power) to 0.3 mW (which is one fifth the actual power). Which is to say: at no point does the intensity of the light, as seen by our camera, drop to zero. We installed dozens of fiber source plates in ATLAS, supplied with light by focusing light injectors.

The fiber source plates themselves contain only two short multi-mode jumpers. One end of the jumper has an FC connector on it and is connected to an FC union. We supply light to the jumpers by connecting two optical fibers to the unions. The photograph above shows the far end of the jumpers, where the polished fiber tips terminate in two zyrconium ferrules. We describe the calibration in more detail in Source Plates.
We rotate a ferrule in a precision hole and measure the displacement of its apparent optical center with rotation. We inject light into the optical fiber with a Five-Way Focusing Injector (A2073). With rotation of the ferrule we obtain standard deviation 23 μm and no sign of a circle. When we peform the same experiment with blue light from an LED, the standard deviation is less than 6 μm.
Coupling LED light into a multi-mode fiber is inefficient with lenses, because the emitting surface of the LED is larger than the fiber. Another way to couple an LED and a fiber is to press the polished tip directly up against the emitting surface of the LED. To do this, we must use LEDs mounted in packages without epoxy sealant, as shown below.
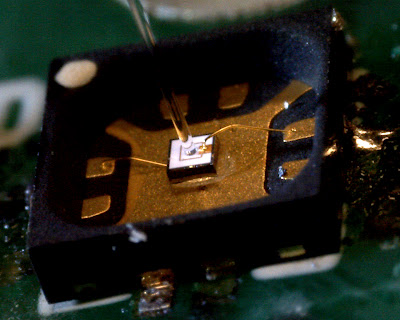
The EZ500 LED shown above will emit up to 150 mW of blue light. This is distributed across an area of roughly 0.2 mm2. When we lower our 62.5-μm core fiber onto the emitting surface, roughly 2% of the light will enter the fiber base. The numerical aperture of standard multi-mode fiber is roughly 0.22, which means all light within ±12.5° of the fiber axis will propagate down the fiber by total internal reflection at the boundaries of the core. As we present elsewhere, such a fiber will be able to contain roughly 5% of the light that enters from the LED at its base. Combining these two effects, we expect to get of order 0.1% of the light emitted by the EZ500 to the far end of our multi-mode fiber.
We glued a multi-mode fiber to an EZ500 and obtained 0.12% coupling efficiency. With 150 mW emitted by the LED, we expect to see 0.15 mW at the far end. Given that the effective power of our existing fiber sources can drop as low as 0.3 mW because of interference, we see that the directly-coupled fiber is a viable light source.
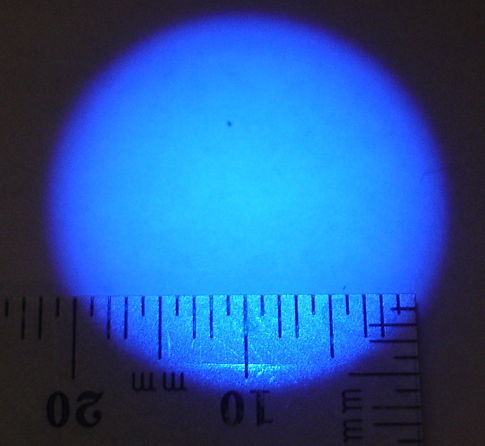
The photograph below shows 460-nm blue light emitted by a 62-μm core of numerical aperture 0.22. The interior angle of the cone is 31°. We expect a fiber with numerical aperture 0.22 to emit light within ±13° of its axis.
We take a C460EZ500 blue LED and mount it in a metal block with a cut-out that fits the LED package. We glue a ferrule with a 62-μm core fiber into a hole on the other side of the block, that is aligned with the center of the LED package. The LED die is not centered well on the package. The edge of the bond pad lies at the package center, and obscures part of the fiber core. We glue the ferrule in place. With 150 mA through the LED we get 110 μW out of the other end of the fiber jumber.
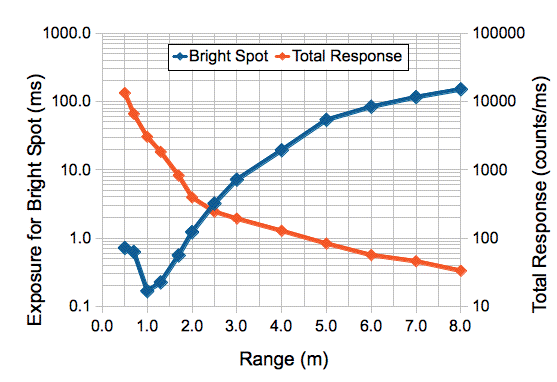
We flash the LED with 150 mA forward current and measure the peak and total intensity of the image, as seen by a Black Polar BCAM. At range 8 m, an exposure time of 100 ms gives a bright spot and 10 ms gives a dim spot that is perfectly adequate for measurement.
[13-JUN-14] We inject 460-nm blue LED light into a 125-μm diameter fiber with 62-μm core using a Fourteen-Way Injector (A2078A). We terminate the fiber with a 2.5-mm diameter zyrconia ferrule. We insert the ferrule in a 2.5-mm hole in an aluminum block. We take pictures of the fiber tip with a TC255P Camera (A2056) while flashing the blue light. We measure the magnification of our image with respect to movements of the fiber tip by deliberately displacing the fiber tip a known distance perpendicular to the camera axis. We rotate the ferrule in the hole. We can now translate movements of the image into movements of the optical center of the fiber tip. If the optical center is a distance r from the physical center of the ferrule, and there is no space between the ferrule and the hole surface, we expect to see the centroid move in a circle of radius r. Our resolution in measuring optical center is 0.6 μm. When we remove and re-insert the ferrule without rotation, the standard deviation of center position is around 3 μm. When we rotate the ferrule we see standard deviation 6 μm, but no sign of a circle. We conclude that the optical center of our fiber is less than 6 μm from the physical center of the ferrule.
We have a green EZ500 with total radiant flux 15 mW at 30 mA (see LED Efficiency). We have a 65-μm core multi-mode fiber with numerical aperture 0.22 glued into a zirconium ferrule and polished. We secure the EZ500's 3-mm square package to an alumunum fixture. A hole in the fixture lines up with the center of the EZ500 die. We press the ferrule into the hole. The depth of the aluminum fixture is such that the ferrule stops just above the die surface. With 30 mA flowing into the LED, we measure of order 15 μW coming out of the other end of the multi-mode fiber.
We take this green fiber tip and view it with a Black Polar BCAM (TC255P image sensor, focal range is 3 m, spot is defocused and large at ranges less than 80 cm). We fix the fiber tip and move the BCAM. The graph below gives the peak intensity of the image after background subtraction, in 8-bit ADC counts per millisecond of flash time, at various ranges, and for two values of forward current (100 mA and 150 mA).
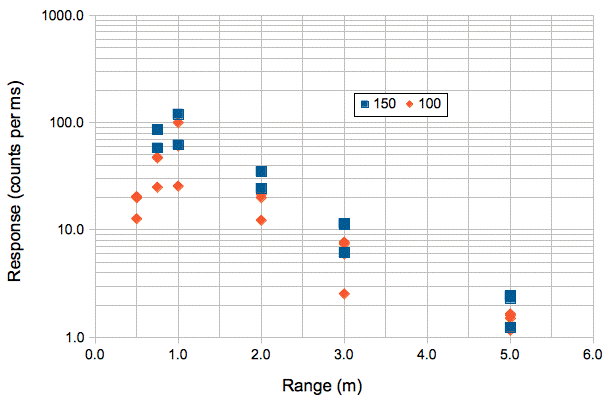
For ranges up to 5 m, the response is greater than 1 counts/ms. The BCAM performs equally well with spots of intensity 30-180 counts (see Exposure Time). With this green light source we will get intensity 30 counts at range 5 m for an exposure time of around 15 ms. Meanwhile, the pattern of light emitted by the fiber tip is a uniform green cone, with no sign of interference patterns.
The Luxeon Z family of LEDs spans wavelengths 450 nm (Royal Blue) to 650 nm (Deep Red). The emitting surface is 1 mm square, with a thin coat of silicone. There are no bond wires on the top side of the chip. Instead, we can solder the LED directly to a printed circuit board with two pads on the bottom side. The LEDs themselves cost less than $1 each. Our EZ500 LEDs also cost less than $1 each, but we had to pay another $20 to get them mounted in a package before we could use them. We found that the surface power density on the Luxeon Z was equal to that of the EZ500, so in theory we can inject as much power into a fiber using this LED as we can with an EZ500.
We tried various colors of Luxeon Z LEDs and measured their output power verus current and monitored their self-heating at currents up to 1000 mA. We report our observations here. A 1-s pulse of 1000 mA through the 650-nm Royal Blue LED causes it to heat up by less than 10°C. At this current, we couple 350 μW into a 100-μm core fiber. From our work with the blue EZ500 LED, we know that a 110-μW blue point source is sufficient to keep exposure times below 20 ms for ranges up to 4 m. A 350-μW source will keep exposure times below 20 ms for ranges up to 7.5 m.
The deep red LED's typical forward voltage drop is 2.2 V at 500 mA, compared to 2.9 V for the royal blue. Thus the deep red uses less electrical power at 1000 mA than the royal blue. But if we pulse the red LED at 1000 mA, we couple only 100 μW into the core of a 100-μm fiber, which is over three times less than for royal blue. In our high energy physics experiments, we want our exposure times to be as short as possible to mitigate the effects of neutron damage in our image sensors. Thus we prefer to use the brighter source, which is the blue LED, even though this means we will be dealing with two colors of light in our BCAM system: red for the BCAM lasers and blue for our fiber light sources.
A light pipe is a plastic fiber for transporting light short distances. We have worked with 250-μm, 500-μm, and 1000-μm plastic light pipes. The following figure shows two 250-μm light pipes with black jackets epoxied to the windows of a pair of BCAM lasers. The other end of each light pipe we glued into an aluminum source plate. Thus we produce a light source that requires no electrical power and no electronic circuit.
Optical center of the tip of the light pipe must be stable to 10 μm or better for this light source to compete with the precision of laser light sources. When we used pipes less than 1 m long, we found that the optical center fluctuated by hundreds of microns when we moved the coil of the light pipe. A light pipe several meters long, with a few tight coils, removes these fluctuations and provides at the same time a uniform distribution of light across the fiber tip.
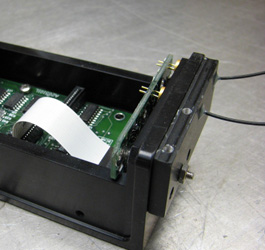
We can attach larger light pipes directly to LEDs, which produce more power than our red lasers. We describe the manufacture of light pipes and how to couple them to LEDS in Pigtailed LEDs. We used 1-mm light pipes to monitor the deformations of a long tube, as we describe in Long Guide Tube.
The photograph below shows the tip of a 340-μm diameter glass fiber, tapered to a point. A taper causes light propagating down the fiber core to reflect at greater and greater angles to the surface of the fiber, until it escapes. The light escapes in all directions. The tip is most visible from the front, easily visible from the side, and somewhat visible from behind.
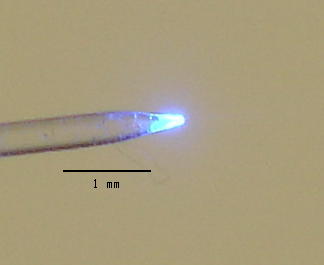
We see that the light-emitting region of the taper, as viewed from the side, is roughly 300 μm long, with the brightest portion being perhaps 100 μm in diameter. Given that the entire light source is of order 100 μm in diameter, we can hope for its light centroid to be constant to within 10 μm as we view the taper from different angles. Thus we may be able to use such a taper as a uni-directional light source. We might replace lasers facing in opposite directions with a single taper viewed from opposite directions.
We placed this taper 5 m from a BCAM with focal range 3-m for red light. The BCAM was equipped with a lens of focal length 48 mm and an ICX424AL image sensor. The taper was pointing straight up, and viewed by the BCAM from the side. We moved the taper in horizontal steps of 100 μm with a micrometer stage. We fitted a straight line to the image position and so obtained the magnification of the image. From this we deduced the position of the image as suggested by the stage. The following graph shows the residuals from a straight line fit to both the x and y components of the spot position. We plot these in units of microns versus the horizontal position of the image in units of pixel. The ICX424AL pixels are 7.4 μm square. We are looking for cyclic non-linearity that might arise from features at the edges of pixels, or from the centroid of the taper varying strongly with viewing angle.
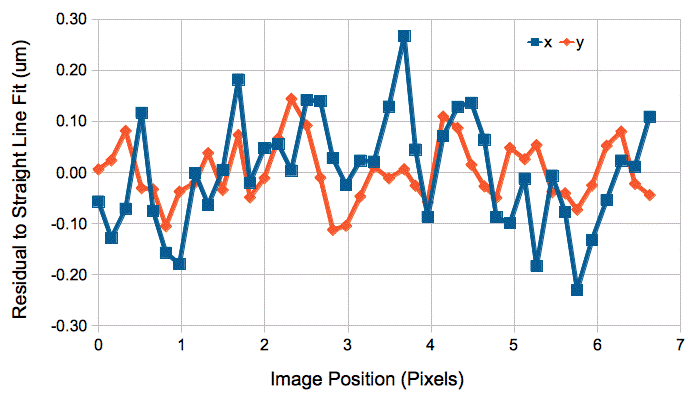
The standard deviation of the residuals is roughly 0.1 μm. Given the magnification of 1/80, the optical centroid of the taper remains fixed with respect to its physical center to within 8 μm during our total movement of 4.5 mm across the field of view.
The fiber shown above has a silica core 300-μm in diameter, surrounded by a layer of silica cladding 20 μm thick (part number WF300/330P37 from Ceramoptec). Its numerical aperture is 0.37, which means that rays entering the fiber within 22° of the optical axis will propagate by total internal reflection along the fiber core. Most multi-mode fiber has numerical aperture 0.22, for acceptance angle ±13°.
We inserted light into this fiber with another fiber of the same type that we glued directly to the exposed surface of a blue LED, as we describe in LED-Fiber Coupling. The high numerical aperture of this fiber allows us to capture three times as much light as ordinary fiber.
We obtained a variety of retroreflecting tape targets from the CERN Survey Group. We mounted several different types upon pieces of black anodized aluminum. The light emitted by a BCAM's laser diodes is insufficiently bright to view in reflection from this tape, even at a range of 1 m. We used instead an infra-red LED array provided by a Proximity Mask Head (A2045). In later experiments, we used an array of ultra-bright visible red LEDs and obtained similar results.
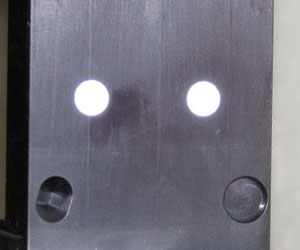
With the nine-LED array, we were able to detect and analyze the retroreflecting target image for ranges up to 3 m.

To obtain a stable measurement of the light centroid, we configured the BCAM Instrument especially for the large, dim images of the retroreflecting targets, as we list in the following table.
| Parameter | Value | Comment | |
|---|---|---|---|
| analysis_threshold | 55 % | threshold is 55% from the minimum to maximum intensity | |
| daq_flash_seconds | 0.1 | turn on the illumination for 100 ms | |
| daq_source_device_element | 1 | to select the LED array in the A2045 | |
| daq_subtract_background | 1 | subtract a background image to remove ambient light |
Because we are shining light upon the entire field of view of the BCAM, we see reflections from objects within the field of view. We can eliminate reflections from light sources other than the LED array by taking a second image with the array turned off, and subtracting it from our first image. But we cannot eliminate reflections of our flashing light source from other objects within the field of view. These reflections can sometimes be as bright or brighter than the one we obtain from the retroreflecting tape.
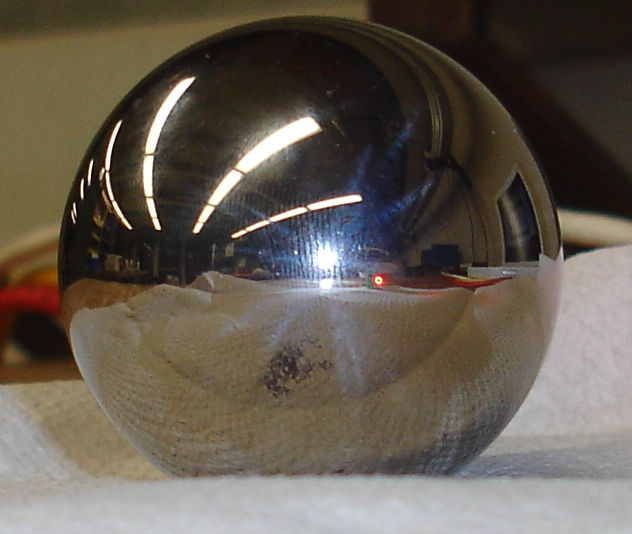
Ball bearings, being spherical, act like a concave mirror, reflecting a de-magnified view of the world around the ball. If we shine a light at a steel ball, we see the light reflected in its spherical surface. If we hold this light close to our eye, the reflection will be brightest, because the reflectance of a mirror surface is greatest for rays normal to the surface. Even for perpendicular rays, however, the reflection is dim, on account of the de-magnifying action of the convex reflecting surface.
In the figure below, we see the reflection of a fifty-millimeter diameter steel ball. The bright white reflection is the camera flash. The image sensor is saturated by the white light. Note the figer-prints visible on the ball surface in the reflection of the flash. Non-uniformity in the reflectance of the surface turns out to have a strong effect upon the apparent centroid of any reflected light source. We see the reflected laboratory over-head lights, and the surrounding laboraroty. The red spot with a black center is the reflection of a laser diode 20 cm from the ball. The black spot in the center is the result of Fresnel Interference, which we see with out-of-focus images of point sources in BCAMs.
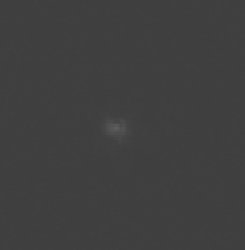
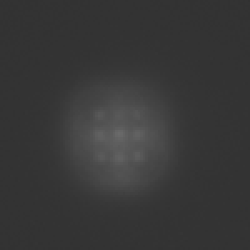
The figure below shows close-ups of images we obtain with BCAMs. One we obtain with a laser. The other we obtain with an array of nine LEDs provided by a Proximity Mask Head (A2045).
The ball-bearing reflects the light sources in a concave mirror. The figure below shows how the rays from the source arrive at the camera. If we assume that the ray from the source reflects from the center of the ball and returns to the camera, we will suffer a measurement error, s, as shown in the diagram.

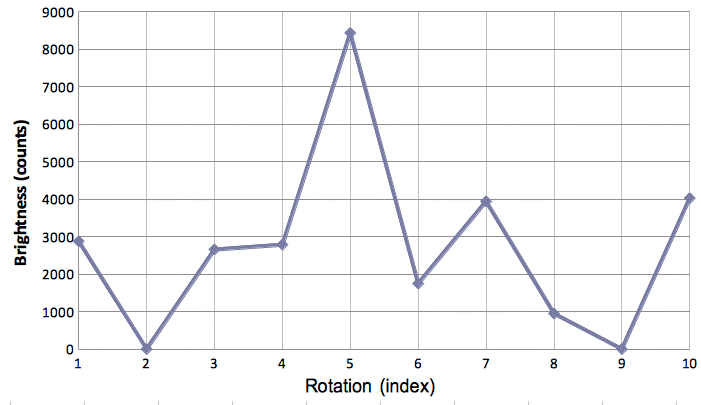
We took a 20-mm steel ball and polished it with a cloth. To the naked eye it did not look like a perfect mirror, but it did not have noticeable scratches or dirt. We rotated the ball ten times took an image of a BCAM laser with the BCAM's own camer for each rotation. The ball was 75 cm from the BCAM. We obtained the following variation in brighteness with rotation.
We moved a 50-mm ball from range 30 cm to 200 cm in front of a BCAM. At each range we took an image of one of the BCAM lasers as seen in reflection in the ball surface. At all ranges, the image of the laser was only a few pixels wide. We measured the total brightness of the image by multiplying the peak intensity above threshold and the number of pixels in the spot.
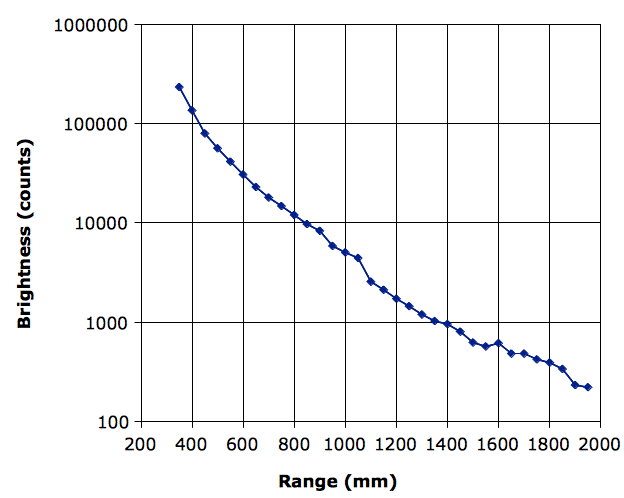
Our logarithmic plot of brightness versus range has a slope of −4.06. The reflected light power light decreases as the fourth power of the range. This is indeed what we expect from our ray diagram. An object along AB of length h subtends an angle θ = hr/2a2 at the camera. The effective range of the object is 2a2/r. With a 50-mm ball at 1 m, we receive the same amount of light as if the LED array were in direct view at range 40 m.
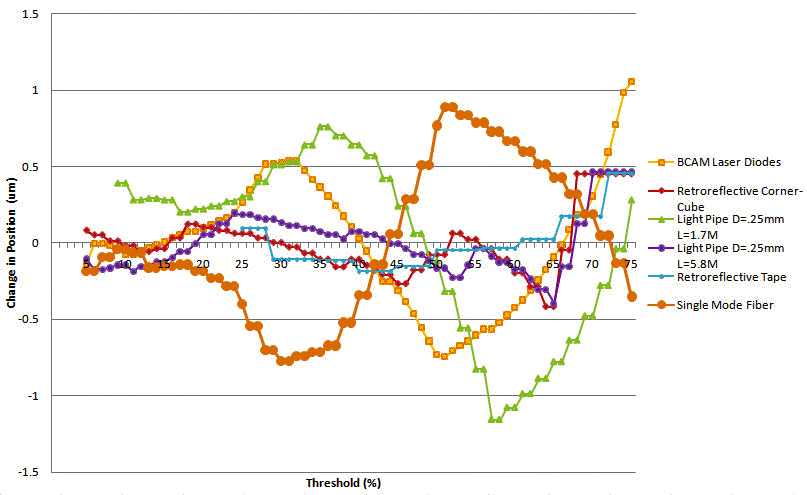
To determine how sensitive a device is to the intensity of the light spot, we plotted centroid offset versus threshold. We recorded the centroid position at thresholds "5 %" to "75 %". The retroreflective tape did not function below a threshold of "25 %". Threshold is discussed in more detail in the BCAM User Manual. The ideal source would provide us with an image that does not move at all with the threshold intensity. But we see that all the sources we tested provide image stability better than ±1 μm for a wide range of thresholds, and if we restrict the threshold to lie near 10% of the net intensity of the spot, the uncertainty in spot position due to threshold variations will be less than 0.1 μm.
We moved pairs of sources with a micrometer stage 1.5 m from a BCAM and moved them 10-mm across a camera's field of view. The camera was a Black Azimuthal BCAM equipped with a TC255P image sensor.
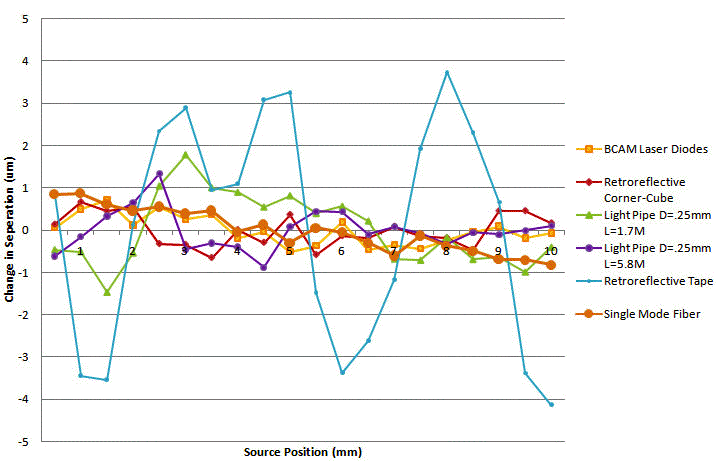
The separation of the sources should, of course, remain constant as we move them across the field of view. We see that most sources provide similar precision. The exceptions are the light pipe with a short fiber and the retroreflecting tape. The short fiber causes fluctuations in the light distribution at the fiber tip when we move the fibers. The retroreflecting tape provides a large image, and the distribution of light within this image varies as the angle of view changes.
Our favored sources are laser diodes, which provide a perfect point source for measurement. In high-radiation or cryogenic spaces, we can multi-mode glass fibers. These can be radiation-resistant. The tip of the fiber can be enclosed in a precise ceramic ferrule, which allows us to measure its location directly with a CMM. Single-mode fibers are just just as precise, but they it is much harder to inject light into a single-mode fiber.