
Figure: Derivation of Mass Flow Rate Relation to Sensor Temperature.
The LWDAQ Gas Flowmeter detects the flow of gas around a temperature sensor by heating the sensor and measuring how fast it cools down. The faster the gas is moving, the faster the sensor will cool down. The flowmeter uses 1000-Ω platinum RTDs (resistance temperature devices). We can connect up to eleven of these to a single Flowmeter Head (A2053F). The A2053F provides a heater and resitance measurement for 1000-Ω RTDs. We manage the RTDs with the LWDAQ Flowmeter Instrument, which allows us to heat the sensor for a specific time, record its temperature as it cools down, and calculate the cooling time constant.
The RTD sensors we use for flow measurement are rectangular and thin. If we orient them so that their large face is parallel with the gas flow, they present a thin cross section to the on-coming gas. Let us assume that the gas flow is slow enough that the flow across the sensor surface will be laminar, then we see that all parts of the sensor, on both sides, are cooled by the gas at the same rate. Let us further assume that conduction of heat through the sensor itself is rapid, so that its temperature is uniform. In a similar fasion, let us assume that the cooling sensor does not warm up the gas significantly in comparison to the initial difference in temperature between the heated sensor and the on-coming gas. With these assumptions, and some dimensional analysis, we conclude that the viscosity of the gas does not affect the rate of cooling, and that the rate of cooling is proportional to the mass flow rate per unit area.

Solving the above first-order differential equation starting with the sensor at some temperature hotter than the gas, we obtain a time constant of cooling that is independent of the absolute temperature difference between the sensor and the gas. For gas flow that is fast enough to be unaffected by the heat of the sensor, but slow enough to remain laminar across the sensor surface, the mass flow rate per unit area will be inversely proportional to the cooling time constant and the gas specific heat capacity. If we install our sensor in a particular pipe fixture, the mass flow per second through the pipe will likewise be inversely proportional to the time constant and specific heat capacity.
Our RTD Gas Flowmeters consist of one or more 1000-Ω RTDs in a sensor block. The block has pipe fittings on either side. We connect the sensor block to a known flow mass flow rate of a gas of known specific heat capacity. We measure the inverse time constant of the sensor cool-down. We now have a constant of proportionality that relates the mass flow rate through the sensor block to the time constant and gas specific heat capacity. We use this constant to measure mass flow rate for any gas at any temperature, pressure, and flow rate, provided that our initial assumptions about the gas flow remain effective.
We note that the equilibrium temperature of a heated sensor is also a function of gas flow rate. The faster the flow, the lower the equilibrium temperature. But heating a sensor and measuring its temperature at the same time present us with practical problems. The resistance of the sensor increases with temperature, so the power it dissipates with a fixed heating current increases, or with a fixed heating voltage it decreases. As we are heating the sensor, it disturbs the temperature of the surrounding gas to a greater degree than if we simply allow the sensor to cool from an elevated temperature. In the end, we found that heating and then cooling was simpler to implement in hardware. But the Flowmeter Instrument does record the peak temperature above ambient after heating, so we can use this temperature as an abbreviated flow rate measurement if we like.
Before we can measure the cooling of a sensor in our gas flow, we must heat the sensor. The Flowmeter Head (A2053F) provides a 15-V heating power supply. We connect this to a 1000-Ω RTD and 15 mA flows through the sensor, dissipating 220 mW. In still air, this is sufficient to heat a bare RTD sensor by 30°C in two seconds.
To measure the resistance of a sensor, the A2053F runs a current of roughly 300 μA through the sensor and two reference resistors. This current is constant and the reference resistors are known to 0.01%. The voltages across the sensor and reference resistors are measured by the LWDAQ Driver. By a linear interpolation or extrapolation, obtains the temperature of the sensor.
The Flowmeter Instrument in the LWDAQ Software manages the heating and cooling of an RTD for gas flow measurement. It heats the sensor for a number of seconds, then records and plots the falling temperature. It fits a logarithmic function to the cooling and calculates the time constant. It obtains the standard deviation of the fit residuals as an indication of the precision of the measurement. It its text window, the Flowmeter prints out the inverse time constant, the rms residual, the ambient temperature of the gas, the peak temperature above ambient of the sensor after heating, the sensor temperature above ambient at which the logarithmic fit begins, and the sensor temperature above ambient at which the logarithmic fit ends. We see all of these values printed in long-form in the examble Flowmeter Instrument output below.

We made the above measurement in air propelled by a fan. The mass flow per unit area is proportional to the inverse time constant provided that the flow is fast enough to be undisturbed by the sensor heat, and slow enough that it remains laminar across the sensor surface. Thus we do not expect the flowmeter to work well with stationary gas in a small space, nor in stationary air in an open space. In the small space, the sensor will heat the gas. In the open space, the sensor will cause convection in its neighborhood, which is a kind of flow. Thus we propel the air around our example sensor with a fan. In our experiments, we work with air moving through a pipe.
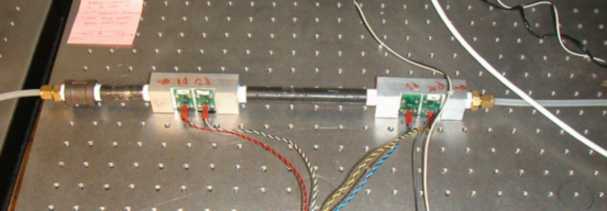
We have two sensor blocks, A1 and A2. Each contains four 1000-&Omeag; RTDs. Block A1 has two sections of two internal diameters, each with two sensors, and is shown below.
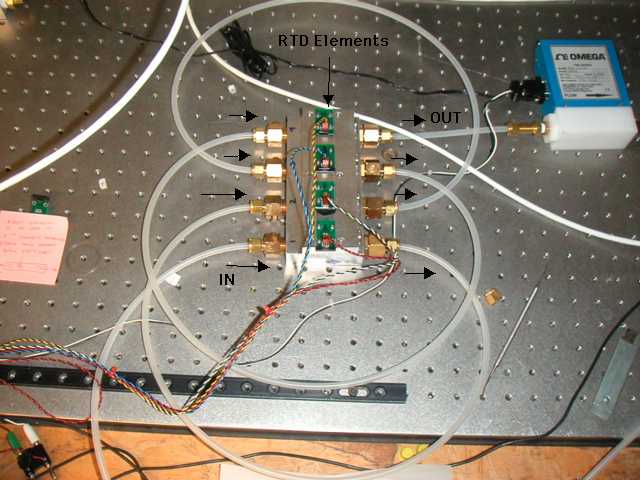
Block A2 has four elements inserted into a single aluminum block with four pipe sections of the same diameter. Piples connect the sections so that gas flows in the same direction across every element.
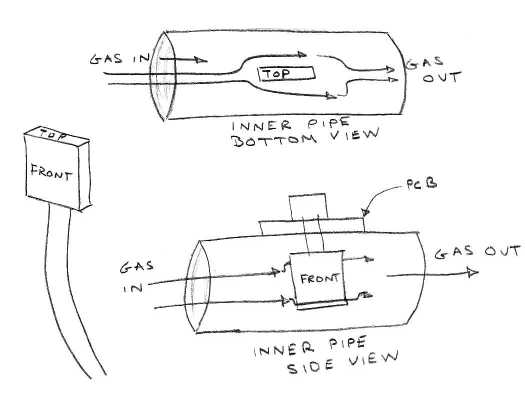
The sensors are platinum film RTDs with nickel-plated stainless steel wires, such as the PPG102A1 from US Sensor. These devices are accurate to ±0.15°C at 0°C. In the sensor blocks, the rectangular sensors are placed in the gas flow so that their large surface is parallel to the flow.
Most commercial flowmeters are calibrated for nitrogen. But the ATLAS muon drift tubes use argon at 210 kPa above atmospheric, or 310 kPa absolute. We obtained canisters of both nitrogen and argon. We connected the test gas to a regulator to drop the pressure from that within the canister, and a gauge pressure manometer. The gas flows through the manometer and proceeds into our test apparatus. When the gas emerges from the apparatus, we pass it through an Omega Mass Flow FMA-A2108 mass flowmeter and a Bronkhorst F-201C-RA-33-V combined mass flowmeter and control valve. The gas exits the Bronkhorst control valve into free air.
The Omega and Bronkhorst flowmeters provide a voltage output proportional to the mass flow. We read this voltage through the LWDAQ with one of our Input-Output Heads (A2057). We use the same A2057 to adjust the Bronkhorst control valve. A single A2053F is sufficient to heat and monitor the four RTD elements.
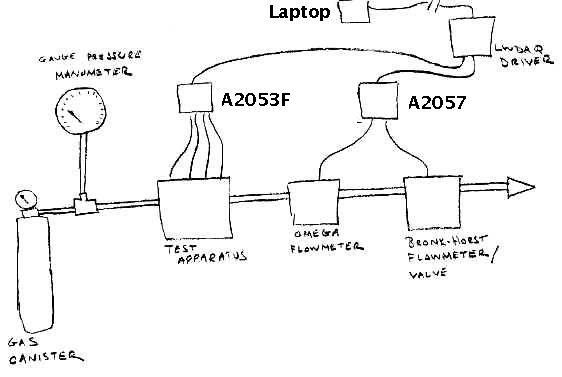
We collect data from all parts of the experiment remotely with our Mass_Flow.tcl script. We can control the mass flow rate with the Bronkhorst valve, and measure the gas flow with both the Omega and Bronkhorst sensors. Thus we can compare the cooling inverse time constant of our sensors to the measured gas flow, and test the relationship between the two. The only thing we must do by hand is turn on the gas at the canister.
The Omega FMA-A2108 operates for flow rates 0-5 standard liters per minute (slm). A standard liter is the volume the gas would occupy if it were nitrogen or air at 0°C and 100 kPa. It is accurate to ±0.05 sml (1% of full scale) and repeatable to ±0.0075 slm (±0.15% of full scale).
The Bronkhorst F-201C-RA-33-V operates for 0-1.250 standard liters/min of nitrogen. Its accuracy is around ±2 slm. The flow control valve stability also around ±2 slm.
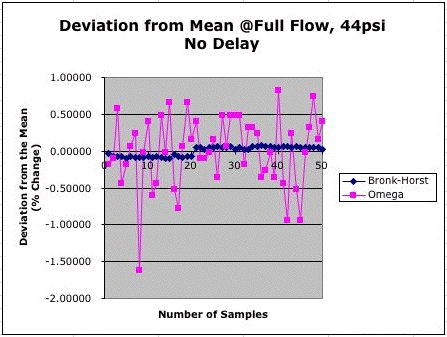
We applied nitrogen at 300 kPa to our appratus and opened the Bronkhorst control valve fully. The Omega measurement stability as ±0.5%, and the Bronkhorst's ±0.1%.
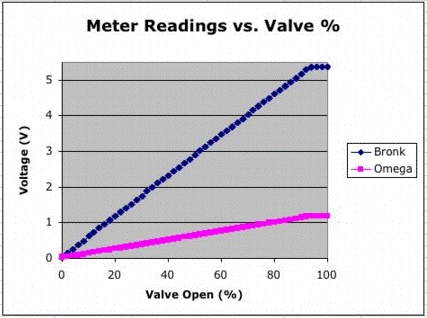
With inlet nitrogen at 300 kPa we varied the control valve from 0% to 100% open. Each valve setting proceeded as follows. We open the valve by 2% of full scale. We wait 25 seconds for the valve to settle. We measure the voltage output from both meters. The graph in below shows the output of both meters as the valve opens. We see that the flow measured by both meters stops increasing when the control valve is supposed to be at 90% of fully open. Thus we will open the valve only to 90% in future experiments.
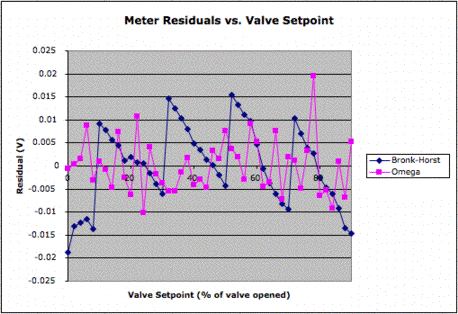
We fit straight lines to the output voltages for set points 0% to 90%. We plot them below. If we assume the valve is operating perfectly to increase the flow in a linear fasion, these residuals represent errors in the flowmeter measurements. Both meters are meeting their specifications.
We plotted the output of the Omega against that of the Bronkhorst. The slope of this line is 0.23 V/V. Looking at the 0-5 V dynamic ranges of the two meters, we expect the slope to be 1.25/5.00 = 0.25 V/V.
The residuals on the right suggest that the two sensors, once their scaling factors are corrected for, will agree well for nitrogen flow at constant pressure and temperature.
Sensor block A1 has two different pipe diameters. Sensors A1.1 and A1.2 are in a 6-mm diameter pipe. Sensors A1.3 and A1.4 are in a 10-mm diameter pipe. At one end of A1 is an extra piece of pipe in front of element A1.1. This pipe allows the gas flow to become laminar before it enters the sensor block. We define the forward direction of gas flow to be flow entering the extra pipe and passing over sensors A1.1-A1.4 in numerical order. The reverse direction is when the gas flows in the plastic pipe. In the reverse direction, there is a sudden change in pipe diameter when the gas enters the 10-mm sensor block.
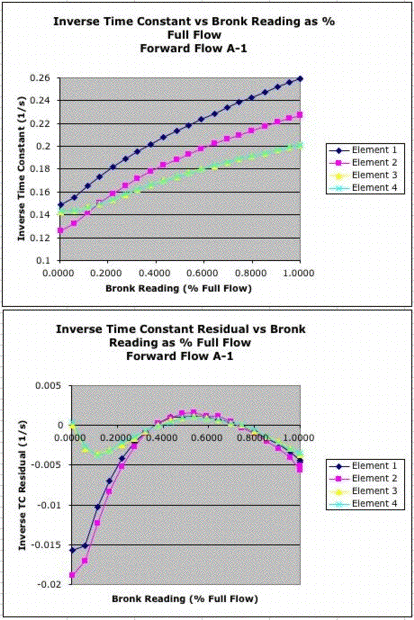
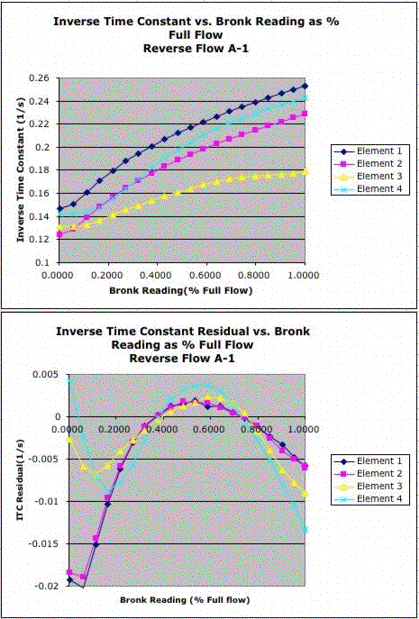
Elements A1.3 and A1.4 agree well with one another in the forward direction. But they disagree in the reverse direction. Elements A1.1 and A1.2 have an offset in their inverse time constants, but their residuals agree in both the forward and reverse directions. In the forware direction, the elements A1.3 and A1.4, in the 10-mm pipe, give better performance than A1.1 and A1.2 in the 6-mm pipe.
Sensor block A2 has all four elements in 6-mm diameter pipes. The lengths of tubing between each pipe are similar and there is enough distance before and after the sensor in the pipe to allow the flow to become laminar.
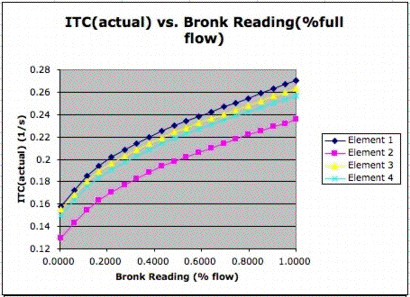
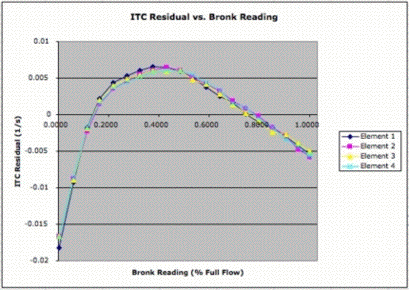
The residuals to a straight line fit lie within ±0.01 s−1 over the full range. The slope of the inverse time constants, when measured over the full range, is 0.002 s−1/%. If we assume the inverse time constant is linear with flow rate, our error will be ±5% of full scale. But we note that the residuals of the four sensors lie within ±0.0005 s−1 of one another across the full range, which suggests that a multi-point calibration could give us absolute accuracy of 0.25%. We also note that the sensors are more linear for flow rates above 20% of full scale. In this range, the residuals lie within ±0.001, so an assumption of linearity would be accurate to 0.5%.
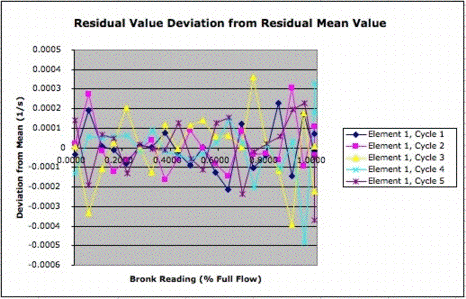
We monitored A2.1 and A2.2 over the full flow range five times on different days. We removed and reinstalled the A2.1 once during this time.
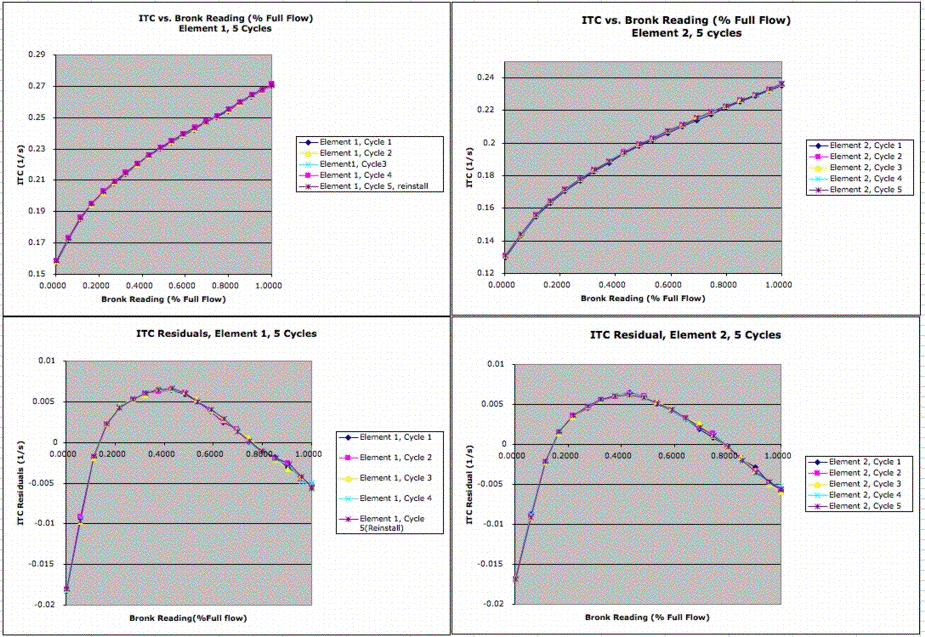
The following graph shows the deviation of each of five cycles with A2.1 from the average of all five cycle. The measurements on different days agree to within ±0.0002 s−1.
We replaced sensors A2.2, A2.3, and A2.4 with new sensors, which we will call A2.8, A2.9, and A2.10. We set the Bronkhorst valve to 50%. We took 56 readings from each sensor with a 30 second delay between each reading. We plot the deviation of the inverse time constants from the mean of each sensor's inverse time constant.
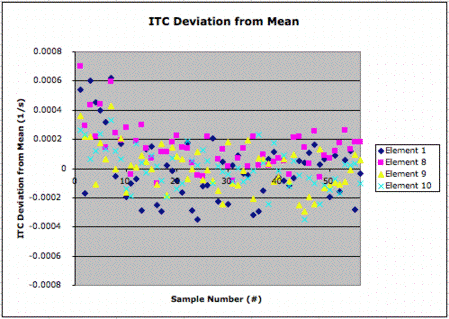
The standard deviation for each sensor is around 0.0003 s−1. This deviation represents our sensor resolution, and corresponds to roughly 0.3% of our full flow rate. The full flow rate corresponds to a Bronkhorst output voltage of 5.2 V, or 1.3 slm. Thus our RTD flowmeter resolution is around 0.4 standard milliliters per minute.
Our RTD flowmeter resolution is 0.4 standard milliliters per minute (sml/m) in a 6-mm diameter pipe from flow rates 0-1300 sml/m. But the offset between one sensor and the next is of order ±500 sml/m, and linearity for a given sensor is only ±65 sml/m. In order to obtain accuracy of 1 sml/m, we must resort to a multi-point sensor calibration.
We start by picking on particular sensor to act as a reference. We pick sensor A2.1, or Element One. We calibrate this reference sensor from 0-1300 sml/m (0-100% of valve open) by measuring and recording its inverse time constant at twenty different flow rates in 5% increments. We perform the same measurement for nine other sensors. The graph below shows how the inverse time constants vary across the sensors with flow rate.
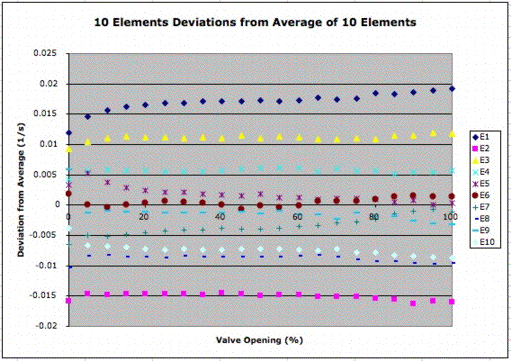
Although the difference between sensors is large, it varies very little with flow rate. We pick the 50% valve open position and record the difference between the inverse time constant of each sensor and that of our reference sensor (A2.1 or E1). We now consider a one-point calibration of each sensor in comparison to our reference sensor. We assume we can obtain the inverse time constant that would be measured by the reference sensor in the same location with the same mass flow rate by subtracting a constant from the inverse time constant measured by the sensor in question. The followng graph shows the error in reference sensor inverse time constant we make with this assumption, plotted versus the Bronkhorst sensor output.
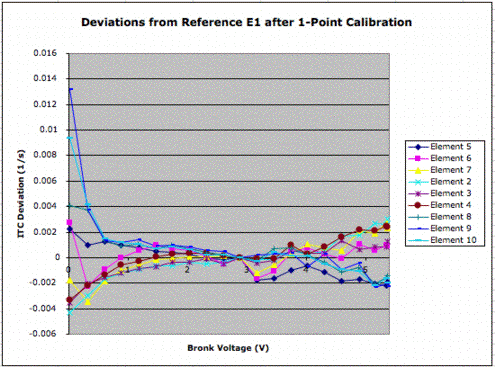
As we explain in our Introduction, we do not expect our RTD Flowmeter to perform well at very low flow rates or very high flow rates. Here we see our one-point calibration performs poorly below 200 sml/m. But from 250 sml/m (1 V) to 1250 sml/m (5 V), the error introduced by our one-point calibration is ±0.0003 s−1 rms. The slope of inverse time constant veruses flow rate is 0.00016 s−1/sml/m (0.002 s−1/%), so our one-point calibration error is 2 sml/s rms in a 6-mm pipe (0.3% of our maximum flow).
Our twenty-point calibration of the reference sensor we apply by linear interpolation to inverse time constants between the measurement points. The result is a measurement of reference sensor inverse time constant to 0.00005 s−1 rms, and accuracy in flow measurement of 0.3 sml/s. Thus our measurement error is dominated by our single-point calibration error of 2 sml/s.
Our standard RTD head uses several EL2244CS operational amplifiers. When we began our calibration testing we noticed that we were not able to obtain our expected calibration precision. The EL2244CS op-amps get hot when taking consecutive measurements, and cool down only when the RTD Head is put to sleep. The heating of the op-amps was causing an offset voltage. We replaced all of the op-amps with JFET input TL082 op-amps which have lower offset voltage temperature coefficients and noticed increased calibration precision. Finally, we replaced all the op-amps with precision OPA2277 op-amps and cured the offset voltage problem all together.
The Bronkhorst valve/mass flowmeter was borrowed from Freiburg. We have since returned the instrument to the Freiburg team. The Brandeis HEP lab has an electronic proportional valve made by Hass Manufacturing in house. This valve can allow a much larger flow than the Bronkhorst. We can restrict the maximum flow through the valve by switching some jumpers on the valve's controller pcb. Inspection of Hass Mfg. manual for their EPV-SS-4MG valve suggests placing jumpers on connectors J5 and J6 so that the valve is allowed to make at most 1 turn from closed to open, or vice versa. We have found that by setting the valve to 80% of 1 turn achieves a maximum flow comparable to the Bronkhorst valve.
Our RTD Gas Flowmeter provides resolution 0.4 sml/m (standard milliliters per minute) mass flow rate resolution in nitrogen at 300 kPa. With a twenty-point calibration curve taken from a single reference sensor, and a single-point calibration of every other sensor, the the RTDs provide absolute accuracy of around 2 sml/m.