| Brandeis University | Physics 29a |
| Spring 2020 | Kevan Hashemi |
Part 1: Construct the following circuit. Use your function generator to generate a square wave for X. Use 10 kΩ for R1 and a photo-resistor for R2. Its resistance decreases as we shine light upon it.

Connect a ×10 probe to X and display X on your oscilloscope. Use a function generator to apply a 10-kHz, 0-5 V square wave to X. For what fraction of the period is the square wave at its high-level voltage? This fraction is the duty cycle of the square wave. Adjust the duty cycle to 50%. With another ×10 probe, display Y. Measure the amplitude of Y with the photo-resistor in light and dark. What is the resistance of the photo-resistor in light and dark?
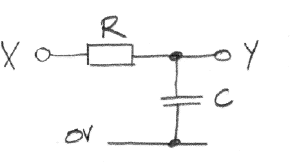
Part 2: Construct the following circuit. Use 1 kΩ for R and choose C to give RC ≈ 100 μs.

Drive X with a 100-Hz square wave and sketch the rising and falling edges of Y. How long does it take Y to move through 63% of its full range after one of the square wave edges? This is the rise time of Y. Increase the frequency to 1 kHz. What is the amplitude of waveform on Y? Sketch one complete cycle of this waveform. Do the same at 10-kHz. Is there any difference between the response of your circuit and a 10-kHz sine wave?
Part 3: Continuing Part 2, choose C for RC ≈ 1 μs. Sketch the rising edges of X and Y and measure their rise times. Does the rise time of Y agree with your calculation? What does the rise time of X imply about the maximum frequency square wave the function generator can produce?
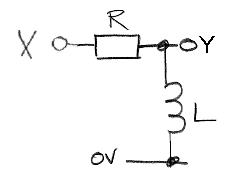
Part 4: Consider the following circuit. In your laboratory notebook, derive an equation for the step-response of Y. You may assume all currents and voltages are zero before the step, and no current leaves the circuit through the Y output.

Construct the circuit with 10 mH for L and 1 kΩ for R. Calculate the time constant of the step response for these values. Apply a 100-Hz square wave to X and sketch the step response of Y, marking amplitude and fall time. Change R to 100 Ω. Sketch and measure Y again. Try to understand any significant difference between your measurements and your calculations.
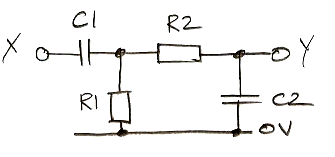
Part 5: Consider the following circuit for the special case R1 = R2 = R and C1 = C2 = C. In your laboratory notebook, derive an equation for the step response of Y.

Build the circuit with R1 = R2 = 1 kΩ, and C1 = C2 = 10 nF. Sketch the step response of the circuit. How does your measurement compare to your calculation?
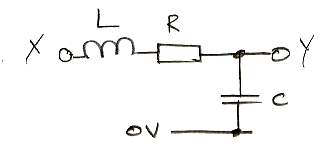
Part 6: Build the following circuit with L = 10 mH, C = 10 nF, and R1 = 330 Ω.

Measure the step response at Y. Why does the step response overshoot its final value?