
Figure: HBCAMs in Neutron Irradiation Area of Van de Graaff Generator.
In 1998 and 1999, HEP conducted fast neutron irradiation tests on image sensors and related components for the ATLAS end-cap alignment system. Those tests were conducted using the neutron irradiation facilities at the University of Massachusetts Lowell. For the nSW upgrade, Brandeis' alignment sensors will be redesigned, based on existing sensors but involving new components which have not been tested for resistance to neutron and gamma ray radiation. We took four ICX-424 image sensors in two HBCAM chassis, as well as 12 LEDs, to Lowell in August of 2014.
Four TC255 image sensors were tested to a dose of 2×10¹² to 8×10¹² 1-MeV equivalent neutrons in the 1998 test. The 2014 test irradiated the ICX-424 at similar distances. The beam energy was 4 MeV for both the 1998 and 2014 tests; however, the beam current in 2014 was 8 uA as opposed to 20 uA in 1998. We have no information as to whether there was any difference in the geometry of the lithium target, so we consider them to be identical. Dose estimates are discussed below.
The exposure lasted six-and-a-half hours with three interruptions of approximately 10 minutes each. Every four minutes, a 1 ms exposure was taken with the BCAM instrument using each image sensor. Immediately following, each LED was exposed for 200 μs and the sum intensity of the spot was recorded.
Every eight minutes, starting eighty minutes into the exposure, one 10 ms and one 100 ms exposure was taken with each image sensor. No light sources were flashed during these exposures. Background subtraction was not used. These images have proven to be the most useful, and this document will focus on them.
Finally, quiescent current readings were taken for all electronics with the board awake, and asleep. Damage to logic circuits from ionizing radiation has been observed to increase the quiescent current consumption of logic circuits. No such increase in current was observed in this iteration of neutron tests.
We will occasionally abbreviate 1012 1-MeV-equivalent neutrons as the non-standard unit "Tn".
The HBCAMs were directly in front of the neutron target with the circuit board level with the bottom half of the target. The ICX-424 image sensors were elevated slightly less than 2.5cm from the beam line by their mounting forks.
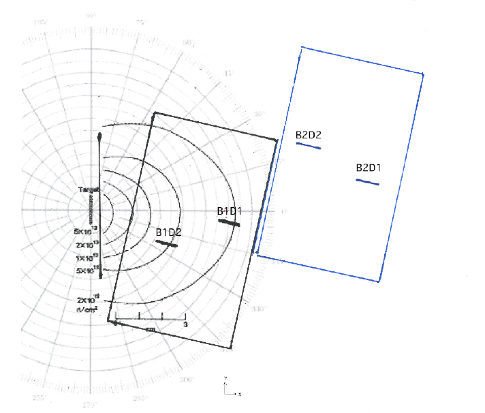
The image sensors were at the following nominal distances, with the origin at the center of the target:

There may be a gradient of neutron fluence across the image sensor, especially for B1D2, where neutron fluence at the extreme corners may vary ±15% from the center. The accumulated dose estimate for the entire image sensor is affected by <1% from this effect. All nominal dose estimates are for the center of the CCD image area.
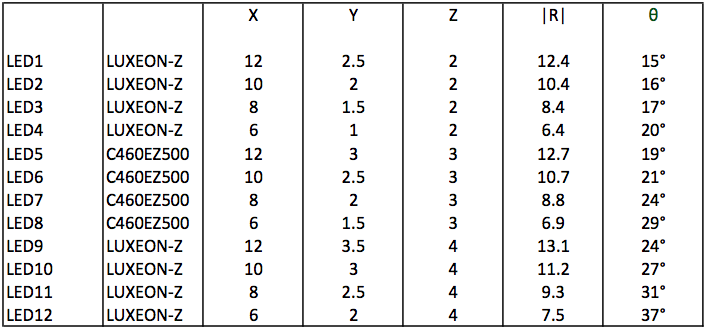
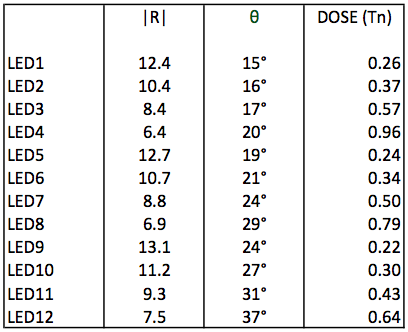
LEDs were set up in a 3x4 array with 1 cm between rows and 2.2 cm between columns:
We have two possible methods for estimating the neutron dose for our image sensors and LEDs at these ranges. We can make solid angle calculations from the number of neutrons produced and correct for angle, or we can extrapolate the output from previous values for UMass Lowell's generator.
UMass Lowell has completed an assay on the lithium target used in the August 5th irradiation and found that 2.75×10¹⁴ neutrons (320 Tn) were produced in the six hours the machine was active. We have completed a Monte Carlo simulation here of neutron fluence with respect to angle. We obtain the following plot from that simulation, with intensities binned every 5 degrees:
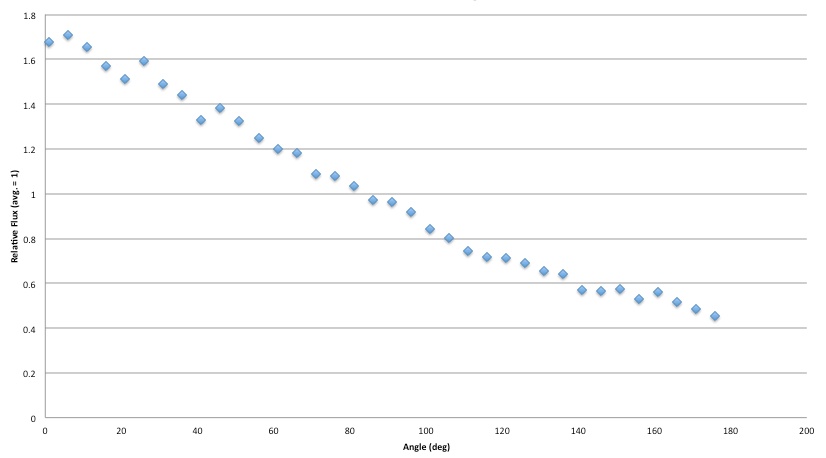
We use the results of this plot as a correction factor from standard solid angle calculations. The plot comes close to the correction factors suggested by the UMass Lowell of two in the forward direction and one-half in the backward direction, which were given as a first approximation. From these correction factors we obtain the following dose estimates:


The second option we have for making a dose estimate is to extrapolate from known doses from previous tests. TC255 "CCD2" received 7.7 Tn in 1998. That test was a 4 MeV, 20 uA beam current, 9 hour exposure. Our 2014 test was a 4 MeV, 8 uA beam current, 6 hour exposure. From our Monte Carlo simulation, a CCD at the location of "CCD2" would have received 1.49 Tn in 2014. Scaling 7.7 Tn to 6 hours and 8 uA, "CCD2" would have received 2.05 Tn in 1998. Our simulations come in at approximately 75% of 1998 estimates.
In addition to a first approximation of dose, UMass Lowell has provided us with the aformentioned Fluences and Spectra of Accelerator Generated Fast Neutrons (1992) which cites somewhat higher dose rates for all distances and angles. Kegel et al. also states that the Van de Graaff generator produces 1 Gy of 422-eV photons for every 3×10¹² neutrons, so we will neglect the presence of gammas in our dose estimates.
In order to establish our ability to use an irradiated ICX-424 for BCAM analysis, we hope to track the relationship of dark current with accumulated neutron dose.
We subtract the average intensity of the 10 ms exposure from the average intensity of the 100 ms exposure at various intervals during the irradiation. This isolates the dark current of the sensor accumulated during exposure from any intensity accumulated during readout. We then plot that measurement against accumulated dose to create the following graph:
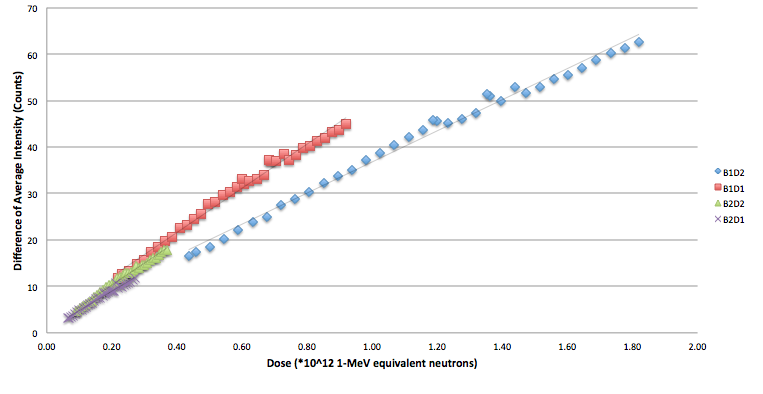
The same graph, with the lower left magnified:
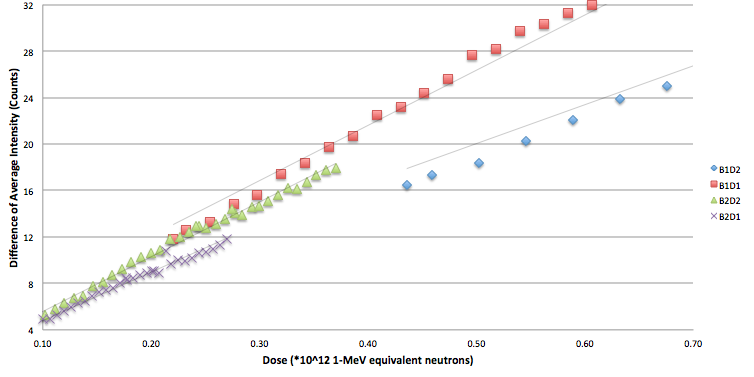
The average intensity calculations from the 100-10 millisecond exposures for all four images sensors give us 42.5 counts/(Tn) for 90 ms, or .472 counts/(ms×Tn).
We also use the Dosimeter instrument to measure the slope of intensity vs. row. This measures the effect of the dark current that accumulates during the readout, which takes just under 200 ms.
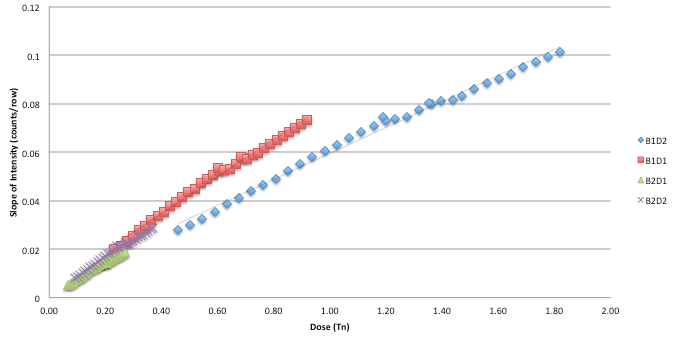
In the New Small Wheel we will read out sensors in quadruple-pixel mode (described briefly here), which will enable a readout time of ~50 ms and a predicted factor of three reduction of dark current slope.
In both the measurements of average intensity and dark current slope, the highest and lowest slopes differ by 42%. The most likely source of error in our measurement of slope is error in the measurement of distance r. We estimate our precision in measuring the location of the BCAM with calipers to be 2 mm. By the inverse square law, a precision of 2 mm in three dimension of measurement would affect the dose accumulated at B1D2 by no more than ±15%. The precision of our angular measurment at B1D2 is no worse than ±4°.
It is also possible that there is an error in our location for the lithium target. Our assumption of -6 mm in the x direction is based on the stated location of "one-quarter inch behind the outer surface." To try and quantify this error would be speculation, so for now we disregard it.


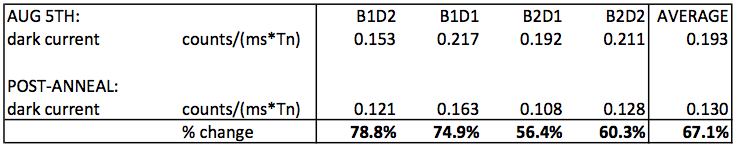
After six weeks, images of 1, 10 and 100 millisecond exposures were taken with each irradiated image sensor. Those exposures were compared with the final exposures from the date of irradiation, at the end of the irradiation period. Also compared were the differences of intensity between 100 ms and 10 ms exposures.

The 100 ms - 10 ms comparison images from the end of the six week period show a reduction in average intensity of between 50% and 53% across all image sensors. This is comparable to the recovery observed in the TC255 in experiments in 1998. Note that this does not imply that 50% of the damage has been repaired, as the average intensity does not intercept at 0. We will continue to track the annealing of these sensors for the remainder of 2014.
In the nSW, we design our system to take 10 ms exposures. With full-scale readout images such as the ones taken in this experiment, the readout process takes 180 ms. For that reason, this dark current accumulation during readout is the dominant form of radiation damage.
We have observed that the dark current in a CCD goes up exponentially as a function of temperature. The TC-255, for example, shows an doubling in dark current for every increase of 8°C. So our ability to tolerate radiation damage is strongly a function of temperature.
We covered the ICX-424 sensor "B1D2" with kapton tape and paper insulation and lowered its temperature to 0°C with electronics "freeze spray". We then allowed the CCD to return slowly to room temperature while periodically recording its dark current. This experiment was repeated twice.
The dark current of the ICX-424 appears to double for every 10°C. Our experiments in the optics lab were conducted at 19°C. We don't have temperature data for the UMass Lowell Radlab, but we were comfortable during the experiment and suspect the temperature was approximately 20-21°C.
From our work in ATLAS with the TC255, we have observed that when we change the threshold of the BCAM instrument, the effect on accuracy is small. The report of our initial neutron tests discuss how much headroom we need to analyze an image at some length (here, pp. 9-13). The conclusion for the previous iteration of the BCAM was that the software could function using only 10% of the sensor's dynamic range. For now, we peform our estimates with the intention of leaving 25 counts of headroom between the saturation intensity (255) and the average intensity of the image.

From this test, it appears that the single-pixel readout of the ICX-424 will function properly until it has been exposed to ~5.2 Tn (5.2×10¹² 1-MeV neutrons).
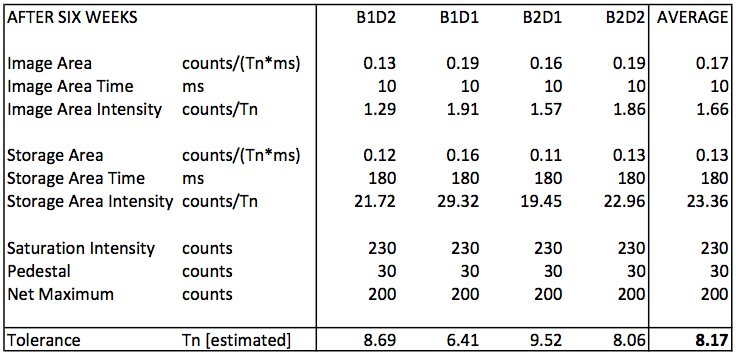
The room temperature recovery of the ICX-424 gives us a more realistic view of the damage we will face in ATLAS. Based on the recovery of the sensor over the course of six weeks, we would increase our estimate of radiation tolerance from 5.2 to 8.2 Tn.
By using the quadruple-pixel readout functionality of the ICX-424, we can decrease the amount of time spent in the readout area by a factor of four. To accomplish this, however, we must bin four pixels together, resulting in a net equivalence in dark current.
The benefit of quadruple-pixel readout will come from its ability to increase the dynamic range of the sensor. In the new Small Wheel, we will design a BCAM with a factor of three lower output gain, decreasing the intensity of the ICX-424's image pixels and dark current. By doing so we will increase the dark current (and therefore neutron damage) tolerance of a 10-ms exposure by 300%. We claim this will increase our radiation tolerance from 8.2 to 24.6 Tn.
We adjust that by 8% to account for the fact that we are completing our testing at 19°C. If ATLAS is for example 2° warmer than expected, we will still be able to tolerate 20 Tn.
We expect to see 4.2 Tn over 10 years at the new luminosity. We can tolerate 23 Tn. This gives us an expected safety factor of over five with respect to neutron damage.
During the experiment, there was no decrease in intensity observed in the irradiated neutrons. The value of the BCAM's sum spot intensity measurement was plotted against dose and the slopes were randomly distributed. However, it is possible that too many of the pixels were above the saturation intensity of 255 to observe downward slope, so the LEDs were compared with unirradiated LEDs after 6 weeks. There was no measurable difference between irradiated and unirradiated LEDs for exposures of 5 and 15 us at a distance of 200 cm.
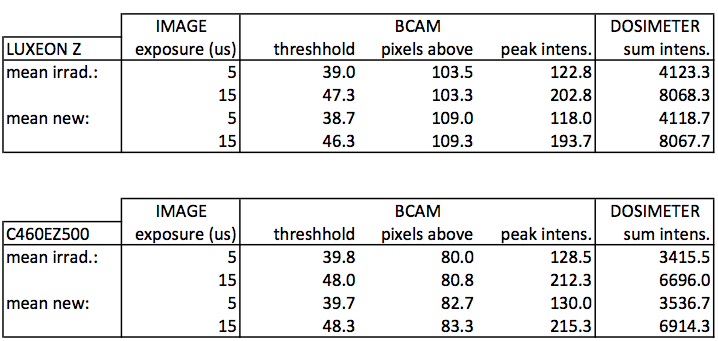
The Philips Luxeon-Z LEDs show no drop in intensity after an average of 5×10¹¹ 1-MeV neutrons. The Cree EZ-500 show a slight difference in LED intensity, but we observed one of the LEDs in the irradiation to be dimmer in images that were taken before neutron exposure. When that LED is removed, there is no measurable difference.
While 0.5 Tn is too small a dose to declare the LEDs impervious to neutron damage, we are yet to observe any decrease in intensity that was seen (here) with the HSDL-4400 infrared LED in tests referenced in our talk in 2003. We are so far optimistic that our higher band-gap blue LEDs will be significantly more radiation-resistant than previous, infrared versions.