Figure: Dark Current in Storage Area, Irradiated CCDs. Taken 15 days after irradiation.
On 5 August 2014, we exposed 4 ICX-424 image sensors (in 2 HBCAMs), 8 Luxeon-Z LEDs (448 nm "Royal Blue"), and 4 Cree EZ-500 LEDs (460 nm "Blue") to neutron radiation at UMass Lowell's Van de Graaff accelerator. A writeup of the results of that experiment can be found here. We estimate that the most irradiated HBCAM received 1.8×10¹² 1-MeV equivalent neutrons in that experiment.
On 22 December, we then delievered four ICX-424, sixteen Luxeon-Z LEDs, and five ~1 meter lengths of fiber optic cable for irradiation at the sister "Fast Neutron Irradiation" facility. The Luxeon Z were four each of 448 nm "Royal Blue", 530 nm "Green", 620 nm "Red", and 655 nm "Deep Red".
The samples received a dose of 2.15×10¹² 1-MeV equivalent neutrons. The incident gamma dose was ~2.5 Gy, which is small enough for us to ignore. Because of regulations involving irradiated material and delays due to holidays, we test the equipment two weeks after the experiment.
We have recently observed that some of our optical fiber has reduced transmission at higher wavelengths under exposure to ionizing radiation. We include six optical fiber lengths to compare the effects of neutron irradiaion on the same phenomenon. We include various colors of Luxeon-Z LEDs to confirm that we can safely switch from 448 nm "Royal Blue" to 655 nm "Deep Red" without additional concerns due to neutron irradiation.
This document will use the abbreviation "Tn" to represent 1×10¹² 1-MeV equivalent (in silicon) neutrons.
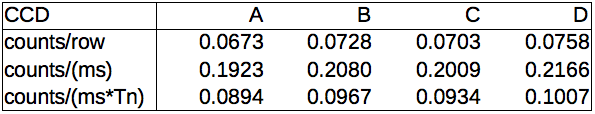
The Dosimeter instrument calculates the dark current of the CCD image area by measuring the slope of the average intensity of the image in counts per row. Each row is read out in 350 milliseconds. We can determine the extent of radiation damage by looking at the dark current in counts/ms per Tn of radiation.
Unirradiated CCDs show virtually no dark current of this type.
The CCDs from the 5th of August showed an average of 0.193 counts/(Tn×ms) at 20°C. We observe a smaller result of 0.095 counts/(Tn×ms) at 14.5°C in our second experiment. We estimate that the dark current in the ICX-424 doubles every 10°C. This means 0.095 counts/(Tn×ms) at 14.5°C normalizes to 0.139 counts/(Tn×ms) at 20°C.
It is difficult to extrapolate how much damage has annealed over 15 days. We will continue to monitor the dark current over the coming weeks. After six weeks, the dark current in CCDs from the August 5th experiment had an average transfer area dark current of 0.130 counts/(Tn×ms) at 19°C, or 0.139 counts/(Tn×ms) at 20°C. We will retest the CCDs from the December 22nd experiment in February and compare these results.
Dark current in the image area can be isolated by subtracting two images of different exposure times. We take a 100 ms exposure and a 10 ms exposure with each image sensor in very low light conditions. We subtract the average intensity of the 100 ms exposure from the average intensity of the 10 ms exposure. The electronic pedestal (~30 counts) and transfer area dark current (discussed above) cancel out in the two images. The remaining intensity is the dark current during image exposure. We expect to use exposures of no more than 10 ms in any new Small Wheel device.
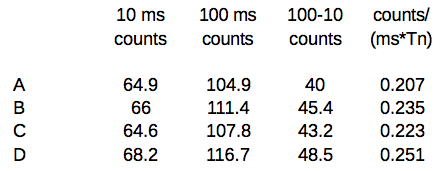
The four image sensors show an average of 0.229 counts/(Tn×ms) at 15°C. We multiply this by the square root of two to normalize it to 20°C, with a result of .324 counts/(Tn×ms). In our August test we observed 0.472 counts/(Tn×ms) during the experiment (~21°C) and 0.262 counts/(Tn×ms) six weeks later (19°C). Those normalize to .441 and .280 respectively. We will continue to observe the recovery of the image sensors in the coming weeks.

We are designing our system in ATLAS to limit exposures to 10 ms. Single-pixel readout takes 180 ms. So, to use single-pixel readout, we must tolerate 10 ms of image area dark current and 180 ms of storage area dark current.
We estimate that we need 10% of the sensor's dynamic range to make an accurate BCAM analysis. This is discussed at length in our neutron results from 1998. We can then comfortably tolerate 200 counts of increased intensity above the 30 count pedestal.
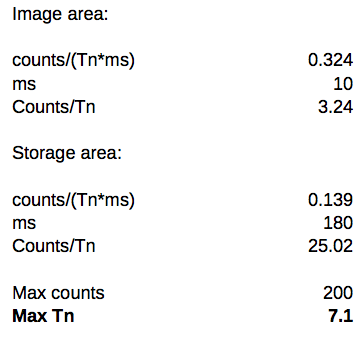
We calculated the tolerance during the August 5th experiment to be 5.2 Tn before annealing and 8.2 Tn after six weeks. So, 7.1 Tn after two weeks corroborates our previous result.
We plan to use 2x2 pixel binning with the ICX-424 to reduce our readout speed from 180 ms to 45 ms. This results in no net gain of tolerance, as each pixel contains four times as much current. However, with pixel binning, we can reduce the gain of the circuit, increasing the dynamic range of the sensor by a factor of three. We claim that this increases our tolerance from 7.2 Tn to 21.6 Tn after two weeks of annealing.
We retake the same images on January 26th, five weeks after the irradiation. We note very little change in the image sensor, which implies that most of the recovery is occuring in the days after damage.
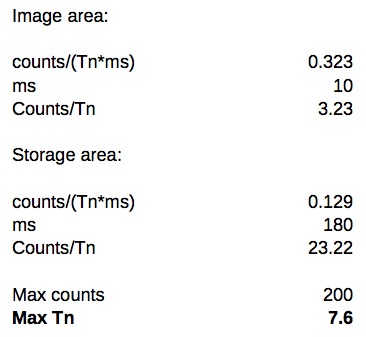
The image sensor dark current is .244 counts/(Tn×ms) at 16°C. This is .323 counts/(Tn×ms) at 20°C. The transfer area dark current is 0.096 counts/(Tn×ms), which is .129 at 20°C. This slightly lower dark current increases our estimated tolerance slightly, to 22.8 Tn.
We replicate the images on March 3rd. It is 16.5°C in the optics lab. The images show .258 counts/(Tn×ms), which is .328 normalized to 20°C. The transfer area dark current is .113 counts/(Tn×ms). So, we have seen no further improvement since the end of January.
We test the intensity of LEDs by using a modified A2078 to supply ~40-45 mA to the LED. (An unmodified A2078 supplies ~150 mA.) We place the LED in contact with a SD445 photodiode and measure the current with a multimeter. We adjust that photocurrent using the responsivity graph provided in the datasheet of the SD445.
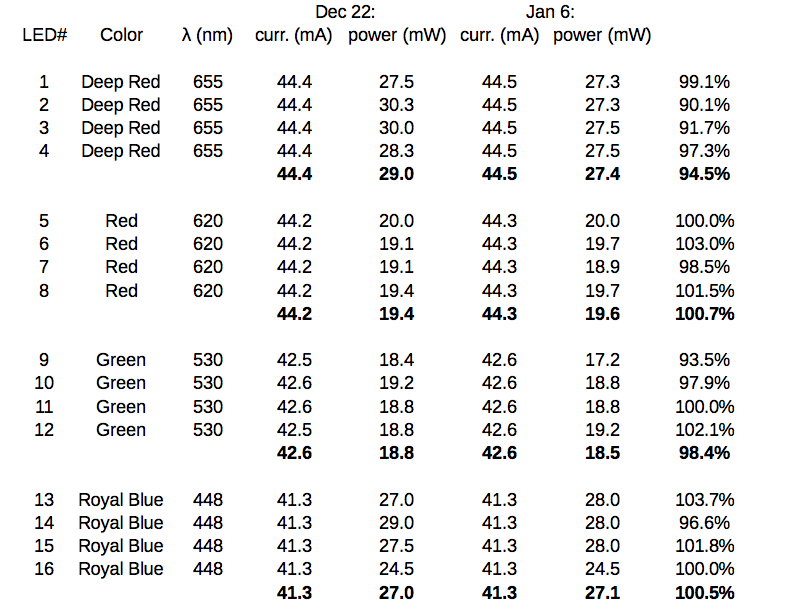
No LEDs show any significant loss of output after 2.15 Tn. The Deep Red LEDs show 5% loss, which is within the margin of error, and the other LEDs remain the same. We will perform one more test of approximately 20 Tn, and determine if the minor loss observed in the Deep Red LEDs is meaningful.
We inject light into a 62 μm-core fiber jumper connected to a 100 μm-core jumper using a A207901A and Luxeon-Z LEDs. We observe the output using an HBCAM and analyze the resulting spot with the BCAM and Dosimeter instruments. We then insert irradiated lengths of fiber between the two jumpers and retake the same images. We define the "transmission" of a fiber to be the ratio of the intensity of the spot when it is inserted to the intensity of the spot when the two jumpers are connected directly.
Our 62 μm-core fiber is the jacketed Draka Comteq fiber used in the ATLAS BEE upgrade. Its resistance to ionizing radiation is discussed here. The 100 μm-core fiber is CeramOptec WF100/110P37 which is a candidate for use in the new Small Wheel.
We observe that one of the fibers (E1) only has 80% transmission, but we have observed similar drops from small scratches or from bits of dirt on the fiber surface. If the fibers were damaged by radiation, we would expect to see a larger drop in intensity for short wavelengths (Royal Blue) than for long wavelengths (Deep Red). We observe no such pattern for any of the six fibers irradiated to 2.15 Tn.