Radiation Detection with Alignment Sensors
Muon Upgrade Meeting
CERN, 11-NOV-09
Kevan Hashemi, James Bensinger
Physics Department
Brandeis University
http://www.bndhep.net
Note: We removed the page that claimed the spots in an image were the result of fast neutrons interacting with the sensor pixels. We had no basis for this claim, and the fast neutrons involved were mixed with gamma rays, which we know are capable of giving such hits.
Note: We corrected the probability density function for Y-90 beta particle production. In the original talk, this plot was scaled incorrectly. In the corrected version, the area under the curve is 1.0.
Contents
Introduction
Neutron Hits
Dosimeter Hardware
Dosimeter Software
Ionizing Sources
Triple Event
Bright Event
Smeared Event
Strontium-90
Electron Energy
Hit Rates
Dose Rate
Conclusion
Introduction
Reported in August:
- Can measure accumulated neutron dose using image sensors.
- Know temperature to better than 0.2°C rms.
- Measure dark current to better than 0.001 counts/ms = 0.3 e/ms/pixel.
- Deduce neutron dose to 2 × 10⁹ 1 MeV-eq n/cm2 = 0.002 Tn
- At luminosity 1034/cm2s, max end-cap dose ≈ 0.1 Tn/yr.
- At luminosity 1032/cm2s, max end-cap dose ≈ 0.001 Tn/yr.
- Insensitive to initial neutron dose accumulation.
- Robert Richter suggested counting radiation-induced spots in images.
Today's Talk:
- Describe radiation dose measurement by counting spots in images.
- Refer to such spots as hits.
- Illustrate use of TC255P as hit counter using Sr-90 and Co-60 sources.
- TC255P not effective compared to MDT system.
Dosimeter Hardware
- End-cap alignment image sensor is
TC255P.
- Dosimeter uses Inplane Sensor Head
(A2036).
- Senor mounted on TC255P Minimal Head
(A2016P).
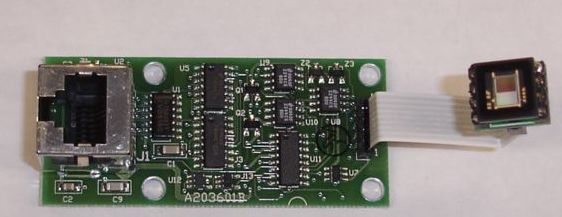
- For Dosimeter, put black tape over sensor to block light.
- Capture 100 ms images in darkness.
- In tests, press sensor against radiation source.
- Image intensity is 8-bit: 0−255 counts.
- Convert pixel intensity to electrons: 1 count = 300 e.
- Convert electrons to ionizing energy: 1 e = 2.25 eV.
Dosimeter Software
- Use our LWDAQ (Long Wire Data Acquisition) Software.
- Have added a new instrument: the Dosimeter.
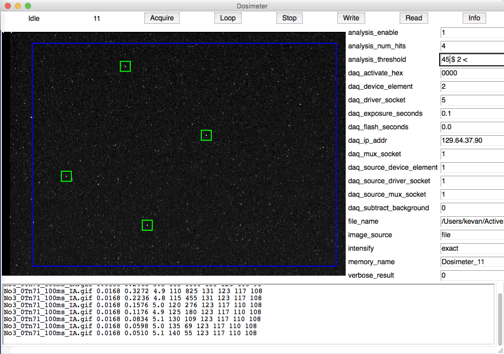
- Hits marked by red boxes on intensified image.
- Calculate dark current (in units of counts/row).
- Lists peak intensities of discovered hits (in units of counts).
Ionizing Sources
Four sources of β and γ radiation, with taped image sensor.

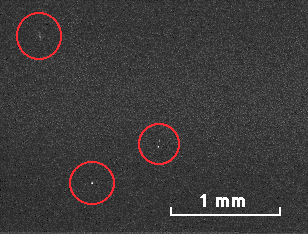
Triple Event
- Three single-pixel hits from a Co-60 γ event.
- Hit energies ≈ 10 keV.
- Suspect interaction of γ with window glass.
Bright Event
- Brightest single-pixel hit from a Co-60 γ.
- Hit energy ≈ 35 keV.
- Suspect end of electron path in pixel.
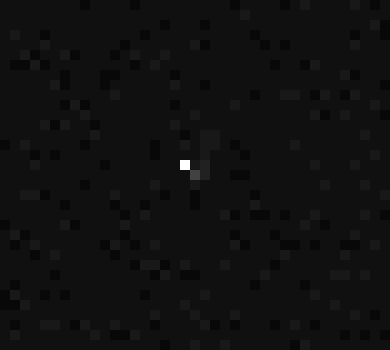
- Sensor charge collection depth is ≈ 10 μm.
- Co-60 γ ≈ 1 MeV, so absorption dominated by Compton scattering.
- Absorption depth 67 mm in Si, 0.01% absorption in 10 μm of Si.
- Most γ events we observe are from interactions outside collection depth.
Smeared Event
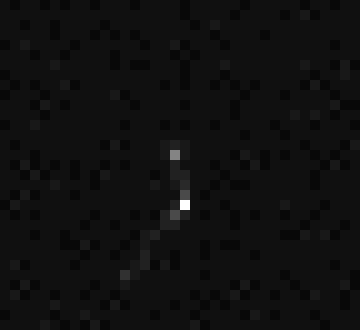
- Smeared hit from a Co-60 γ
- Hit energy ≈ 20 keV summed over bright pixels.
- Only 1% of hits are smeared.
- Suspect compton scattering at large angle in silicon.
Strontium-90
- Sr-90 → 0.55 MeV β + Y-90 → 2.3 MeV β + Zr-90.
- Our source 3000 Bq, get 3000 of each energy β each second.
- Sensor 2.4 mm × 3.4 mm at range 4 mm, so 3% particles go towards it.
- Have 2 mm nylon, 0.2 mm tape, 0.8 mm glass, 1 mm air in β path to sensor.
- 100 each of 2.3 MeV and 0.55 MeV β go towards the sensor.
- CSDA = Continuous Slowing Down Approximation.
- Need roughly 1.1 MeV to travel in straight path to sensor surface.

Electron Energy
- The 2.3 MeV is maximum energy of Y-90 β.
- Average energy is 0.92 MeV.
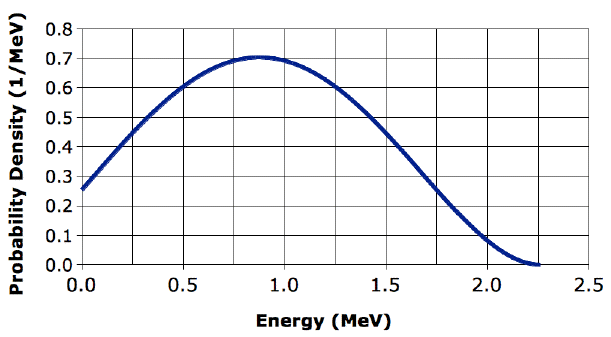
- Glass window blocks all the 0.55 MeV β.
- Glass window blocks most of 2.3 MeV β.
Hit Rates
- Estimate that 90% of β stop in 70% of the CSDA range.
- Estimate that 80% of 2.3 MeV β stop before sensor.
- Expect 20 hits/s at sensor, or 2.0 hits per 100 ms exposure.
- Observe 5.3 hits/s at sensor, or 0.53 hits per 100 ms exposure.
- Table shows hit rate in hits per 100 ms exposure.
| Range |
Nylon (mm) |
Steel (mm) |
Glass (mm) |
Tape (mm) |
Hit Rate |
| 5.0 | 3.0 | 0.0 | 0.8 | 0.2 | 18% |
| 4.0 | 2.0 | 0.0 | 0.8 | 0.2 | 53% |
| 4.25 | 2.0 | 0.25 | 0.8 | 0.2 | 17% |
| 4.5 | 2.0 | 0.50 | 0.8 | 0.2 | 5% |
| 4.75 | 2.0 | 0.75 | 0.8 | 0.2 | 1% |
- We do not understand the discrepancy between our estimated and observed hit rates.
Dose Rate
- Ionizing radiation deposits energy in Si by means of minimum ionizing particles.
- Such particles deposit roughly 2 MeV per g/cm2 of material.
- Observe average hit intensity is 7 counts ≈ 2000 electrons.
- Expect 2-MeV β to deposit 5 keV in 10 μm of Si, enough to generate 2000 electrons.
- Each hit deposits 5 keV in the 8 mm2 × 10 μm charge collection area.
- Each hit deposits 8×10⁻¹⁶ J in 1.9×10⁻⁷ kg of Si.
- Each hit represents a dose of 4.2×10⁻⁹ Gy.
- Max end-cap dose rate is ≈ 7 Gy/yr at inner radius of EM at 1034/cm2s.
- Hit rate in sensors would be 1.7×10⁹ per year = 5.2 hits per 100 ms exposure.
- Our Sr-90 source dose similar to maximum end-cap dose at luminosity 1033/cm2s.
- By taking 100 exposures, we could detect dose rate at luminosity 1032/cm2s.
Conclusion
- Ionizing hits are roughly 2000 electrons, or 5% of pixel capacity.
- Such spots will not be mistaken for light sources, which fill over 50% of pixel capacity.
- Luminosity 1034/cm2s expect 5 hits per exposure at inner radius EM.
- Luminosity 1032/cm2s expect 5 hits per 100 exposures at inner radius EM.
- Can measure peak ionizing radiation dose rates in end cap.
- Can check for shielding failure, calculation error, or other unusual increases in rate.
- But: expect 2.5 hits/image from our Sr-90 source, see only 0.5 hits/image.


