Alignment Electronics
for the New Small Wheel
ATLAS Muon Week in Israel
Weizmann Institute, 05-JUN-14
Kevan Hashemi
Physics Department
Brandeis University
http://www.bndhep.net
Existing System
The ATLAS End-Cap Alignment System Uses roughly:
- 24,000 infra-red LEDs (850 nm)
- 4,400 red lasers (650 nm)
- 4,000 lenses (various diameters and focal lengths)
- 4,000 image sensors (TC255P CCD)
- 2,700 RASNIK mask (various sizes and square pitches)
All powered, controlled, and read out with the Long-Wire Data Acquisition System (LWDAQ).
- 4,500 LWDAQ Devices
- 4,500 Branch Cables (CAT-5, stranded-wire, shielded, up to 10 m)
- 900 LWDAQ Multiplexers
- 900 Root Tables (CAT-5, solid-wire, shielded, up to 130 m)
- 120 LWDAQ Drivers (in USA15 VME crates)
Same system used by: ALICE Geometric Monitoring System, ALICE Space Frame Monitor, LHCb Inner Tracker Alignment, HIE-ISOLDE Alignment, and CMS Technical Coordination.
Overall: The system works well enough.
Obsolete Image Sensor
- Texas Instruments stopped making the TC255P nine years ago.
- We took images with two monochrome sensors and compared them to the TC255.
| Property |
KAC00401 |
ICX424AL |
TC255P |
| Manufacturer |
Eastman Kodak |
Sony Semiconductor |
Texas Instruments |
| Technology |
CMOS |
CCD |
CCD |
| Sensor Area |
5.1 mm × 3.3 mm |
5.8 mm × 4.8 mm |
3.4 mm × 2.4 mm |
| Pixel Dimensions |
6.7 μm × 6.7 μm |
7.4 μm × 7.4 μm |
10 μm × 10 μm |
| Fill Factor |
Estimate <80% |
Observe ≈100% |
Observe >90% |
| Uniformity of Dark Current |
10% |
1% |
1% |
| Uniformity of Sensitivity |
10% |
1% |
1% |
| Package Size |
12.2 mm × 12.2 mm |
12.2 mmm × 9.5 mm |
10.0 mm × 10.0 mm |
| Control Interface |
Volatile Configuration Bits |
Clock Voltages |
Clock Voltages |
| Output Format |
Serial Digital |
Pixel Voltages |
Pixel Voltages |
| Price |
≈$40 |
$40 |
≈$40 |
Table: Comparison of Image Sensors.
Importance of Fill Factor
- The "fill factor" is the fraction of each pixel's surface area that detects light.
- A BCAM images are spots of light. We calculate position of the weighted centroid.
- Insensitive regions interact with bright and dark features in the spot.
Figure: BCAM Images At Various Ranges. Source is 650-nm laser diode. Sensor is TC255.
- Spots with interference fringes generate systematic errors with position within a pixel.
- Rightmost image on TC255P, no such errors.
- Leftmost image on TC255P, cyclic error period three pixels, amplitude 0.5 μm.
- The ICX424AL has fill factor close to 100%, as well as uniform sensitivity and dark current.
- We built a prototype ICX424AL BCAM and tested its linearity over the full dynamic range.
Linearity of ICX424AL BCAM
Figure: ICX424AL BCAM Non-Linearity Across Entire Field of View. Pixels 7.4 μm square. Residuals in microns on sensor plotted versus stage position. Image sharply-focused. Two red lasers at 3.1 m on 300-mm stage, camera focal range 3 m, lens focal length 48 mm, camera V0359. Repeat with poorly-focused spot residuals remain 0.2 μm rms.
Changes Required by ICX424
- Existing LWDAQ Driver with VME Interface (A2037A) cannot support ICX424AL.
- Need a larger logic chip on the driver.
- For nSW, will design and build twenty new LWDAQ Drivers with VME Interface.
- Existing TCPIP-VME Interface (A2064F) too slow for full-resolution ICX424AL images.
- For nSW, will design and build three TCPIP-VME Interfaces seven times faster.
- The ICX424AL is a three-phase device, while TC255P was single-phase.
- The ICX424AL permits pixel binning, which requires double-clocking.
- The ICX424AL camera needs four times the logic gates as the TC255P camera.
- We plan to replace VHC-series logic chips with a programmable device.
- The programmable device must be non-volatile, instant-on, and consume less than 5 mA.
Challenges of New Small Wheel
- The nSW requires triple the number of light sources as the oSW.
- We want to use only the existing LWDAQ root cables.
- The nSW radiation dose will be five times higher.
We solve both the radiation resistance and density problems for light sources by switching to fiber-optic light sources rather than laser diode light sources.
- We can inject power into dozens of optical fibers in one LWDAQ device.
- We can place the injector towards the outer rim of the nSW, so less radiation.
- We run the fibers wherever a light source is needed.
We solve the radiation problem for our cameras by study and adaptation.
- Measure the camera tolerance to ATLAS background radiation.
- Eliminate insufficiently tolerant components and replace with more tolerant ones.
Fiber-Optic Light Sources
- We press the polished end of an optical fiber up against a blue LED.
- The far end of the fiber is a zirconia ferrule with a fiber centered to ±5 μm.
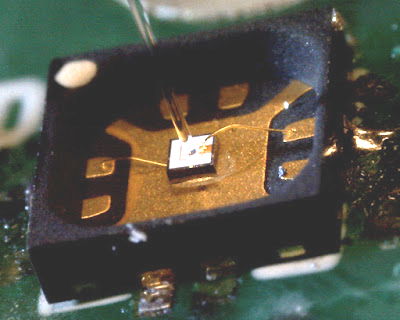
Figure: Contact Injection into Optical Fiber. Fiber diameter 125 μm.
- Blue LEDs are more efficient than any other color.
- In the nSW plan to use LuxeonZ LED, no top-side bond wires.
- Must deliver 1-A drive current to inject the required 100 μW.
Buck Regulator for LED Power
- We plant to take the 30-V LWDAQ power and convert to 4-V to provide 1-A LED drive.
- Air-core toroidal inductor will operate in arbitrarily strong local field.
- Bipolar transistors are well-known for their radiation resistance.
Breadboard Buck Regulator
- Efficiency 70% with 20-V input.
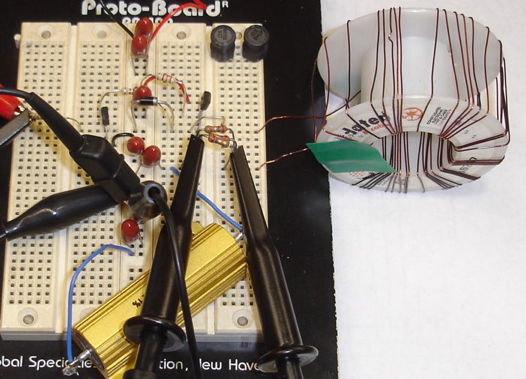
Figure: Breadboard Buck Regulator
- Most of power loss is in resistance of the coil.
- Will try coils with lower resistance, and more compact.
Importance of Radiation Spectra
- To measure tolerance of ATLAS background, must model it in the laboratory.
- To model one spectrum with another, must know both spectra, and prove equivalence.
Figure: Energy Absorption Coefficient for Air and Silicon. Data from NIST.
- A 100-keV γ dose that deposits 1 Gy in Pb deposits only 0.01 Gy in air.
Specrum of ATLAS Background
- Charlie Young provided a list of particles generated by 10k simulated 14-TeV p-p interactions.
- We obtain the following spectrum of photons and neutrons at the inner edge of nSW.
Figure: Simulated Spectra of Photons and Neutrons at Inner Edge of nSW. Bin for <=1keV contains 40,000 thermal neutrons.
Spectrum of ATLAS Background Dose Rate
- Assume 72-mbarn for cross section of p-p inelastic collisions.
- Assume 1034 1/cm2s luminosity and 107s/yr running time.
- Convert photon and neutron frequency into Gy/yr in Si and 1 MeV ea. n/cm2/yr.
Figure: Simulated Dose Rate Spectrum for Photons and Neutrons at Inner Edge of nSW.
Irradiation with X-Rays
We are using x-rays to deliver slow ionizing doses.
- Use 50-keV continuous x-ray source with 3.2-mm Al absorber.
- X-ray spectrum constrained to 14-50 keV.
- These x-rays will penetrate circuit boards and chip packages easily.
- Dose in Si is roughly 7.3 times greater than dose in air.
- Measure dose in air with calibrated ionizing chamber.
- Administer dose over days or weeks, monitor electronics continuously.
- Observe in repeated experiments the same increase in ICX424AL dark current.
We confirmed out dose calibration with a cesium-137 source of 500-keV γ.
- Place ionizing chamber in 500-keV dose and measure dose rate.
- Place ICX424 in chamber and irradiate while monitoring dark current.
- Increase in dark current matches expectation from x-ray experiment.
- ICX424AL dark current increases linearly with ionizing dose.
- Dark current doubles every 8°C increase in temperature.
- With quadruple-pixel readout, can operate at 450 Gy at 20 °C.
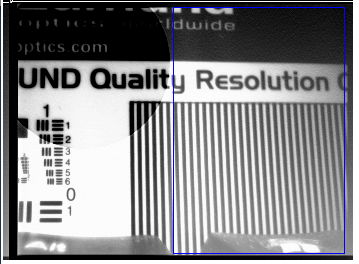
Figure: ICX424AL Image after 450 Gy. Circle marks tungston sphere absorber.
- EZ500 blue LED unaffected by 1 kGy.
- DG419DY analog switch fails after 300 Gy.
- LC4064ZC logic chip fully functional after 1 kGy.
- Total logic quiescent current increases from 3 mA to 4 mA after 1 kGy.
- Note: TC255P barely affected by 1 kGy, still functional after 10 kGy.
Expected ATLAS Doses
Figure: Expected Dose Rate versus Radius in nSW. Assume 5×1034 1/cm2s and 14 TeV.
- We plan to place our sensors at radius ≥2.7 m.
- Ten-year dose at full energy and luminosity is ≤100 Gy.
Neutron Tests
- We plan to perform two fast neutron irradiations this summer.
- TC255P dark current increased linearly with neutron dose.
- Expect ICX424AL dark current to increase with neutron dose also.
- Will determine if neutron and ionizing damage is additive.
- If neutron damage is severe, will double the readout speed with new LWDAQ Drivers.
- Doubling the speed doubles the ICX424 radiation tolerance.
- Expect some drop in LED power with neutron dose.
- Do not expect any problems with logic chips in neutrons.
Single Event Upset Tets
- None of our devices run code or contain RAM cells.
- Power down after data acquisition is standard operating procedure.
- Any disrupted action will be noticed and rectified by repetition.
- Therefore: we are not vulnerable to single event upsets.
- Have no plans to perform single event upset tests.
Conclusion
- New light source: fiber optic cable with contact injection, proven in BEE.
- New image sensor: ICX424AL, accuracy established by prototype BCAMs.
- Will design and build new LWDAQ drivers, multiplexers, and patch panels.
- Believe we understand the ATLAS Background well enough to test radiation tolerance.
- Have been performing ionizing tests.
- Starting neutron tests this summer.
- If ICX424AL is too vulnerable to neutrons, will speed up readout with new drivers.
- Will replace analog switches with discrete mosfet switches.
- New, non-volatile, programmable logic more compact, flexible, tolerates >1 kGy.
- Confident that buck regulator LED power supply will tolerate >1 kGy.
Appendix: Linearity with Quadruple-Pixel Readout
Figure: ICX424 BCAM Non-Linearity Across Entire Field of View with Quadruple-Pixel Readout. Pixels 14.8 μm square. Residuals in microns on the image sensor plotted versus stage position. Image sharply-focused. Two red lasers at 3.1 m on 300-mm stage, lens focal length 48 mm, camera V0359. Repeat with poorly-focused spot residuals remain 0.2 μm rms.
Appendix: Dose Map from Background Group
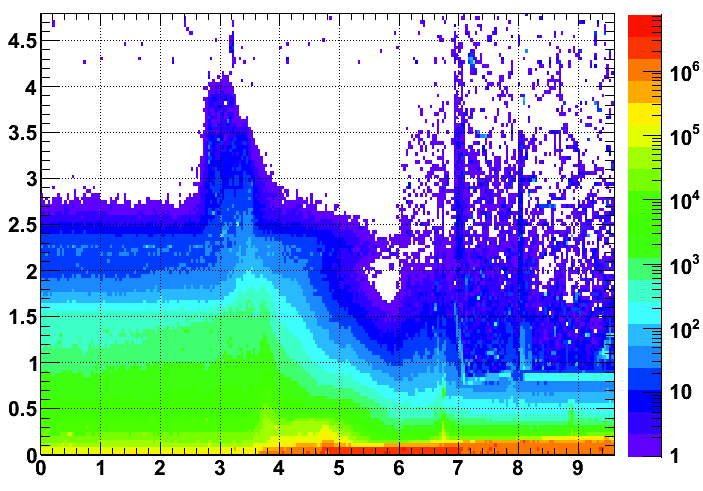
Figure: Simulated Total Annual Ionizing Dose, Gy/yr. Luminosity 1034 1/cm2s, energy 14 TeV, 107 s running per year, 2012 detector geometry.